Fig. 4.
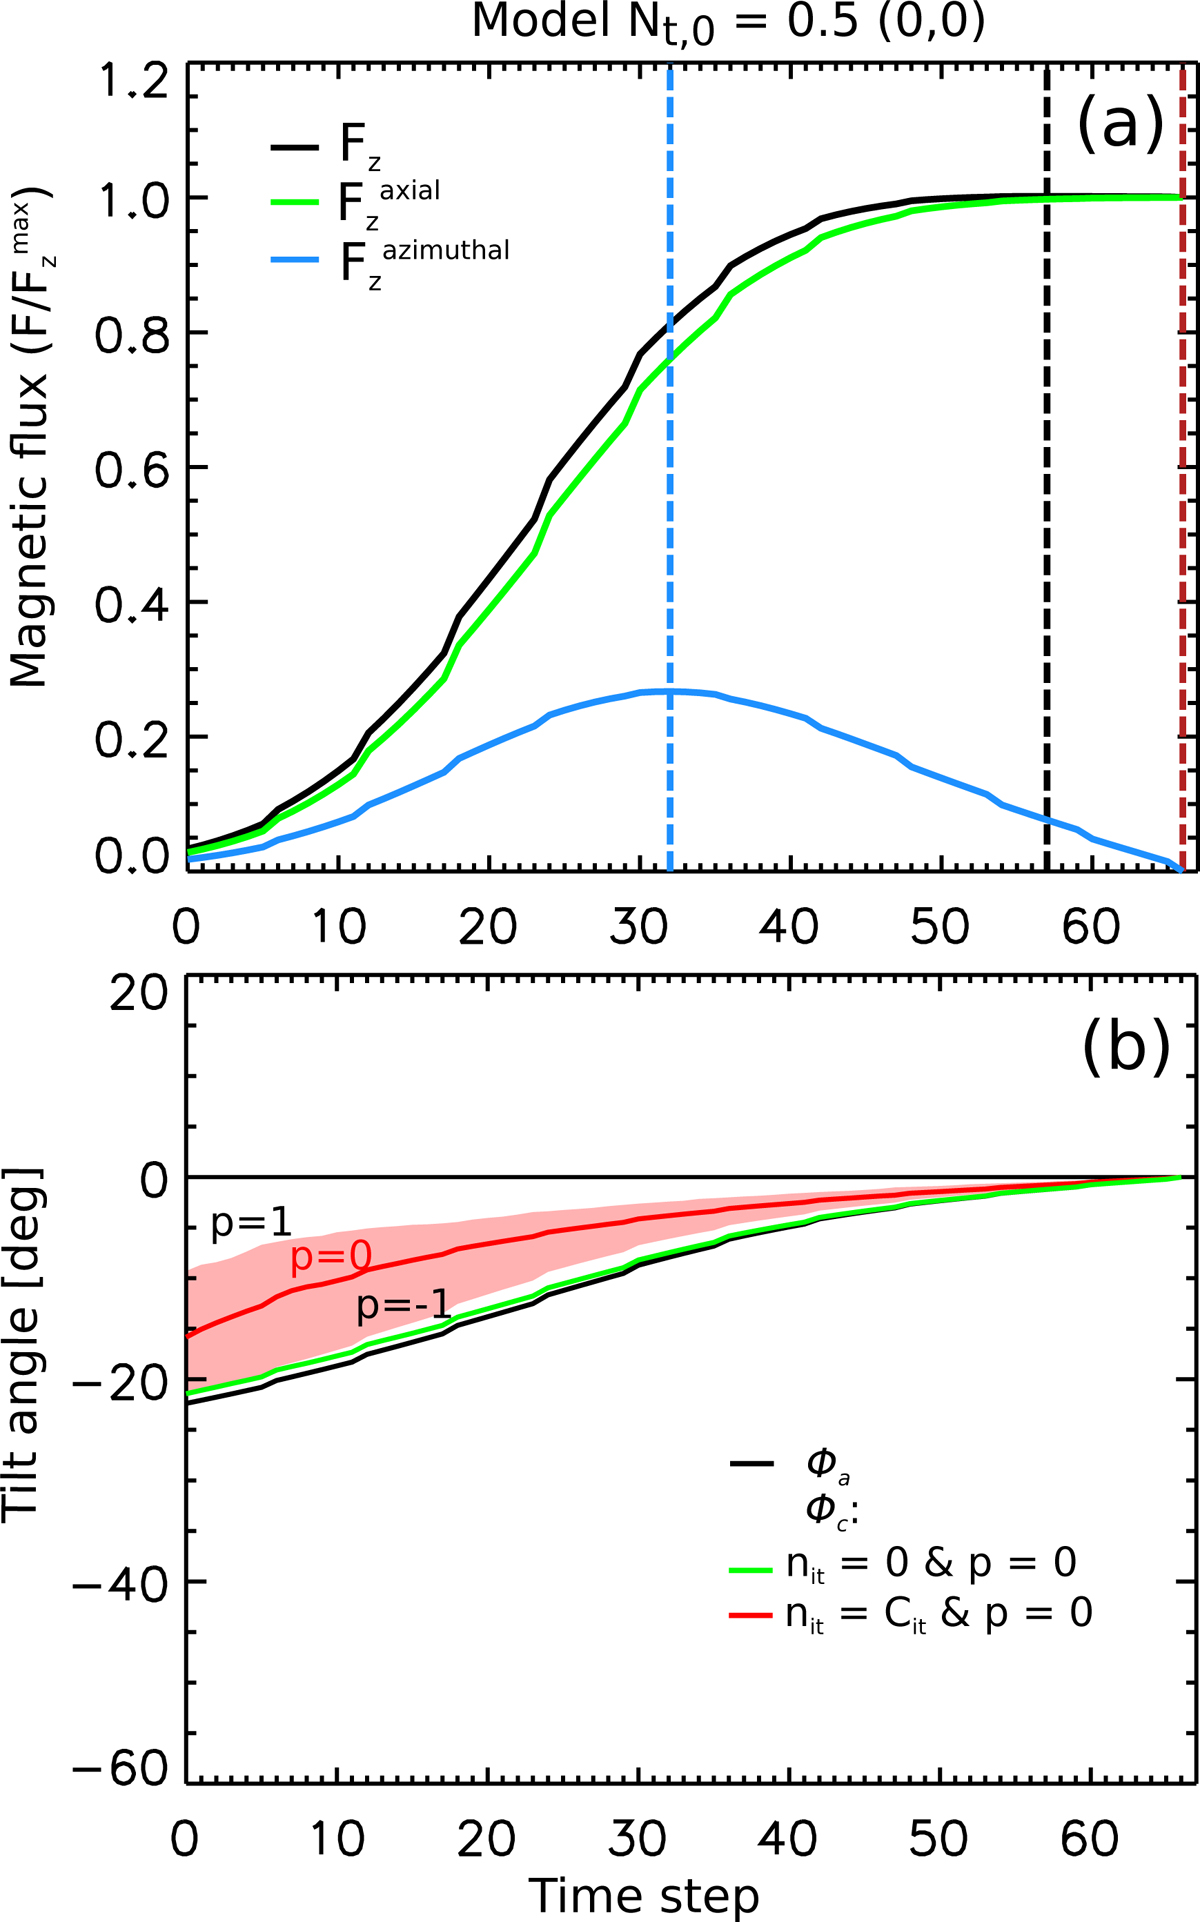
(a) Evolution of the magnetic flux computed from the synthetic magnetograms for the FR model with uniform twist (Nt, 0 = 0.5, h = g = 0) during its emergence. We plot the magnetic flux [Fz] (black line), the axial flux [![]() ] (green line), and the azimuthal flux [
] (green line), and the azimuthal flux [![]() ] (blue line). All fluxes are computed for the z component of the fields. All fluxes are normalised to the maximum axial FR flux. (b) Evolution of the apparent tilt ϕa computed from the magnetic barycentres (on the full magnetogram, black line) and ϕc using CoFFE with p = 0 for two nit values (see the inset). The coloured-shaded area surrounding the red line represents the ϕc range obtained for different values of p within the interval [−1, 1] after the convergence criterion of the tilt angle is achieved.
] (blue line). All fluxes are computed for the z component of the fields. All fluxes are normalised to the maximum axial FR flux. (b) Evolution of the apparent tilt ϕa computed from the magnetic barycentres (on the full magnetogram, black line) and ϕc using CoFFE with p = 0 for two nit values (see the inset). The coloured-shaded area surrounding the red line represents the ϕc range obtained for different values of p within the interval [−1, 1] after the convergence criterion of the tilt angle is achieved.
Current usage metrics show cumulative count of Article Views (full-text article views including HTML views, PDF and ePub downloads, according to the available data) and Abstracts Views on Vision4Press platform.
Data correspond to usage on the plateform after 2015. The current usage metrics is available 48-96 hours after online publication and is updated daily on week days.
Initial download of the metrics may take a while.