Fig. 3.
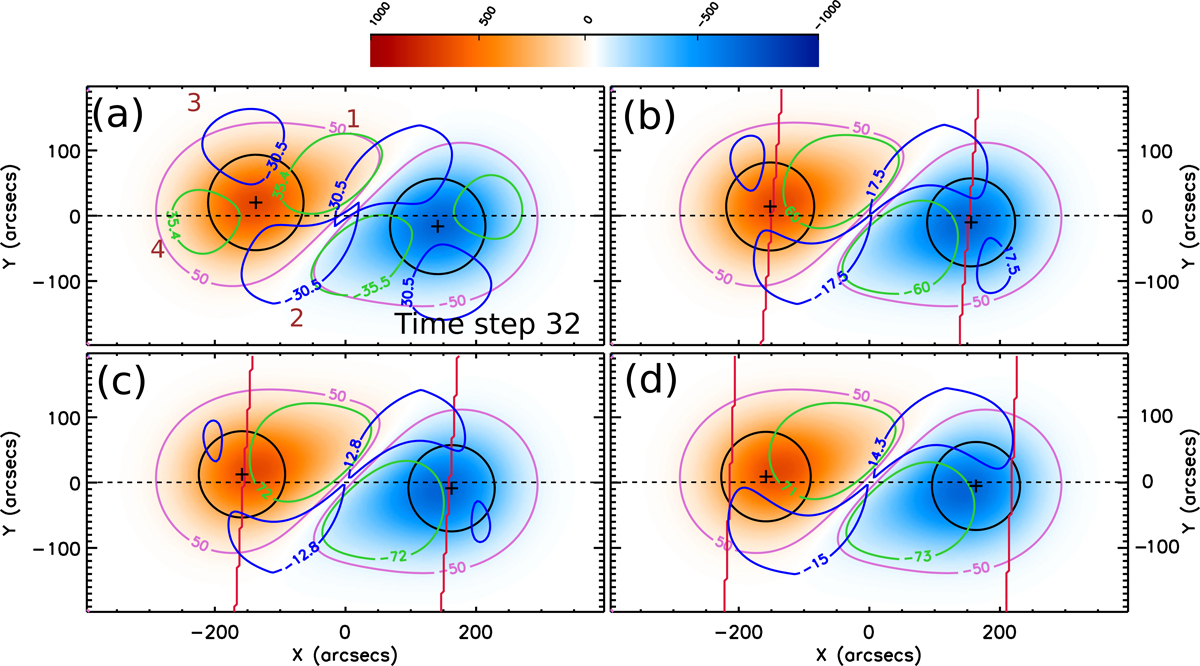
(a) Synthetic Bz magnetogram for the torus model with uniform twist (Nt, 0 = 0.5, h = 0, g = 0) at time step i = 32. We use the same coloured code and isocontours levels for Bz than the ones used in Fig. 1. The black circles over each polarity represent the contour level of 0.5 Bmax of the Gaussian function that best fits the magnetic field distribution. The position of the maximum value for each Gaussian is marked with a + symbol. The green and blue isocontours indicate the areas where the field is larger and lower than the fitted Gaussian, respectively (by 50% of the maximum difference between the Gaussian function values and the synthetic magnetogram). The red lines, defined as discussed in Sect. 2.2, delimit the area which is excluded from the computation of the Gaussian fit in the next iteration step. (b) Same as (a) but one iteration step forward in the procedure (nit = 1). (c) Three iterations further (nit=Cit = 4). The associated movie is available online (fig3_c.avi). (d) Same as (c) but with the exclusion area extended one σ (Gaussian width) towards the outer part of the magnetic bipole (see Sect. 2.2).
Current usage metrics show cumulative count of Article Views (full-text article views including HTML views, PDF and ePub downloads, according to the available data) and Abstracts Views on Vision4Press platform.
Data correspond to usage on the plateform after 2015. The current usage metrics is available 48-96 hours after online publication and is updated daily on week days.
Initial download of the metrics may take a while.