Fig. 2.
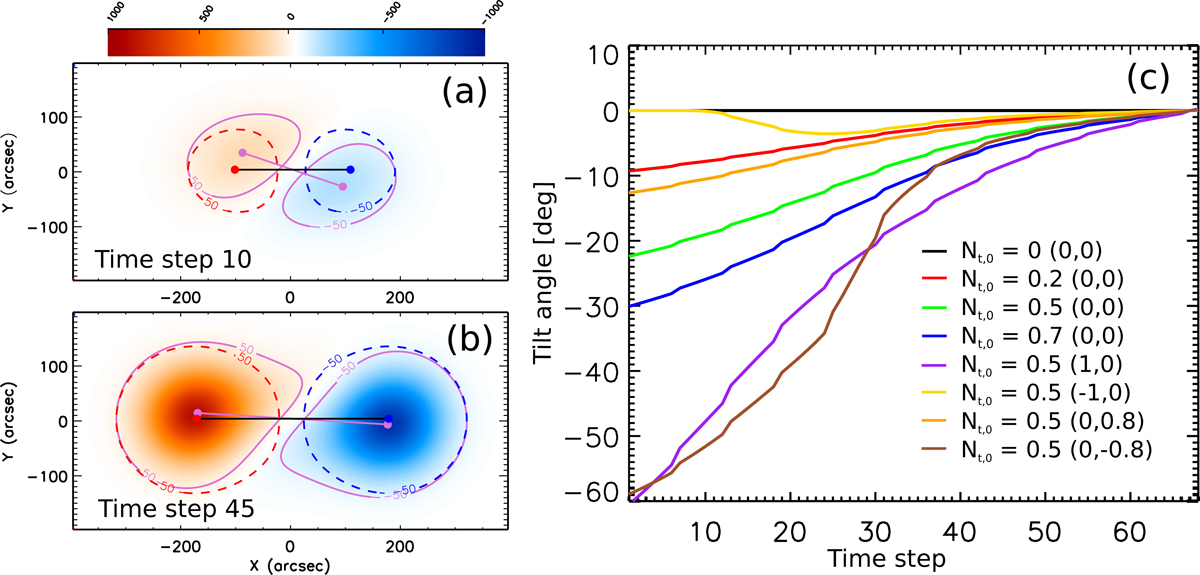
(a)–(b) Synthetic magnetograms for the FR emergence model with Nt, 0 = 0.5 (h = 0, g = 0) at two different time steps of the evolution. The red and blue dashed-contours correspond to the |Bz| = 50 G isocontours of the axial field map (Fig. 1a). The magnetic field strength on the FR axis is set to 1000 G. The red and blue dots show the position of the magnetic barycentres of the axial map and the black segment in between indicates an intrinsic tilt ϕi = 0. The |Bz| = 50 G isocontours of the total map (see also Fig. 1c) are drawn with magenta continuous lines. The magenta line that joins the total map barycentres indicates an apparent tilt ϕa. (c) Evolution of ϕa for the uniform-twist models with Nt, 0 = 0, 0.2, 0.5, 0.7 (black, red, green and blue continuous lines, respectively). The non-uniform twist models have a fixed value of Nt, 0 = 0.5 and (h, g) values indicated between brackets (violet, yellow, orange, and brown continuous lines, respectively). The associated movie is available online (fig2_a.avi).
Current usage metrics show cumulative count of Article Views (full-text article views including HTML views, PDF and ePub downloads, according to the available data) and Abstracts Views on Vision4Press platform.
Data correspond to usage on the plateform after 2015. The current usage metrics is available 48-96 hours after online publication and is updated daily on week days.
Initial download of the metrics may take a while.