Fig. A.1.
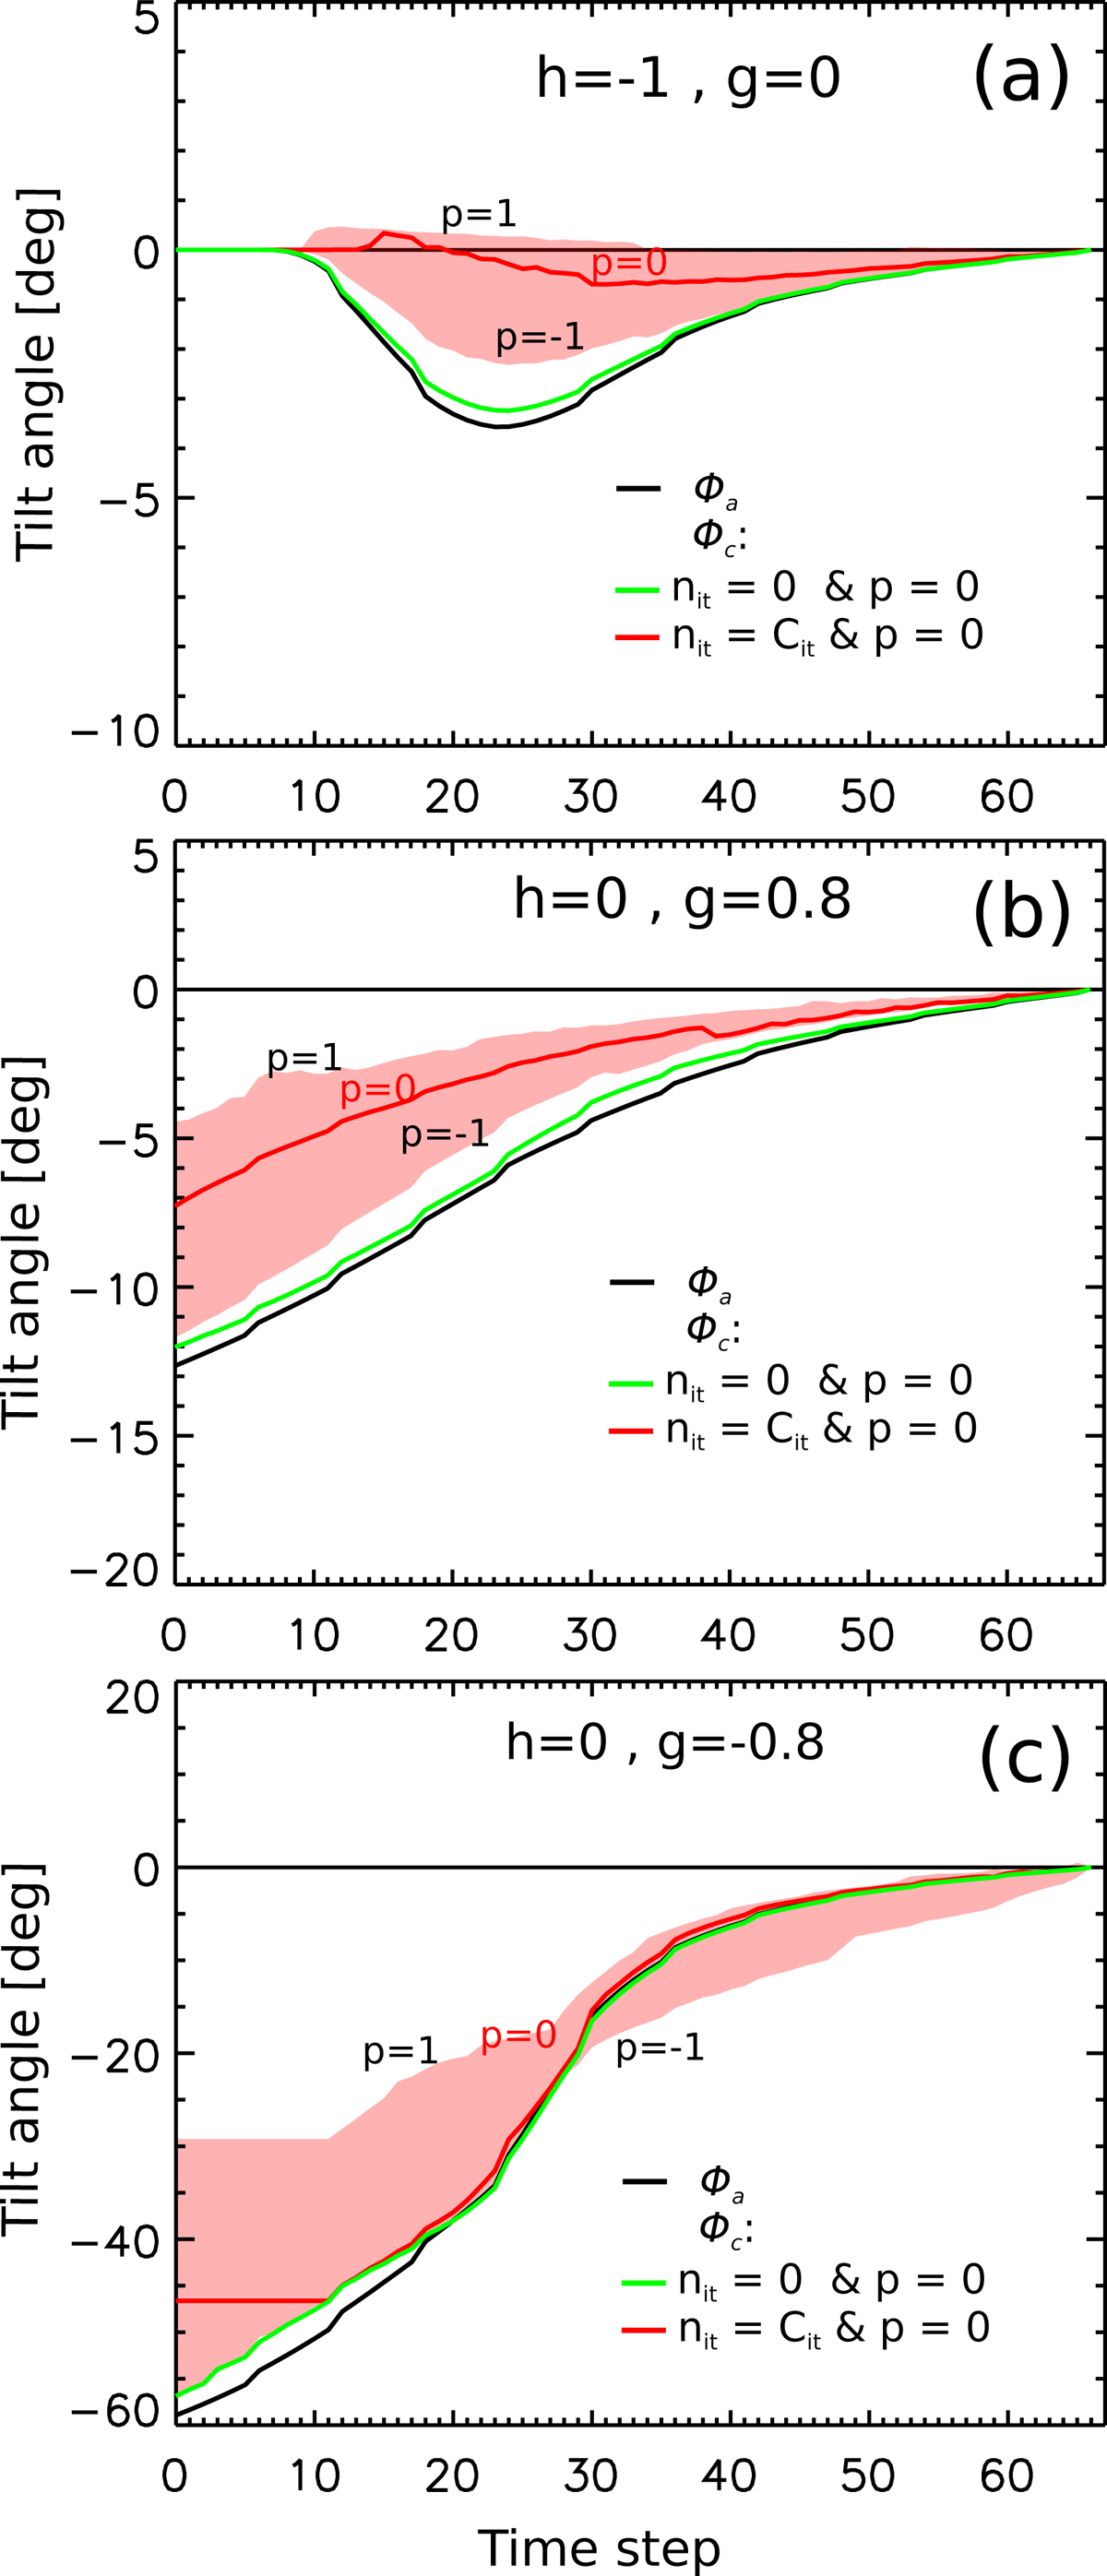
Evolution of the tilt angle for non-uniform twist models with Nt, 0 = 0.5 and (a) h = −1, g = 0, (b) h = 0, g = 0.8, and (c) h = 0, g = −0.8. The black line shows the apparent tilt angle estimations obtained from the polarity barycentres, ϕa. We plot ϕc computed with CoFFE without (green) and with convergence (red) achieved (see inset). The red-shaded area corresponds to the estimation of ϕc computed with different values of p within the interval [−1, 1] and after achieving the convergence criterion of the tilt angle described in Sect. 2.2. The associated movies are available online (fig11_a.avi, fig11_b.avi, and fig11_c.avi).
Current usage metrics show cumulative count of Article Views (full-text article views including HTML views, PDF and ePub downloads, according to the available data) and Abstracts Views on Vision4Press platform.
Data correspond to usage on the plateform after 2015. The current usage metrics is available 48-96 hours after online publication and is updated daily on week days.
Initial download of the metrics may take a while.