Fig. 1.
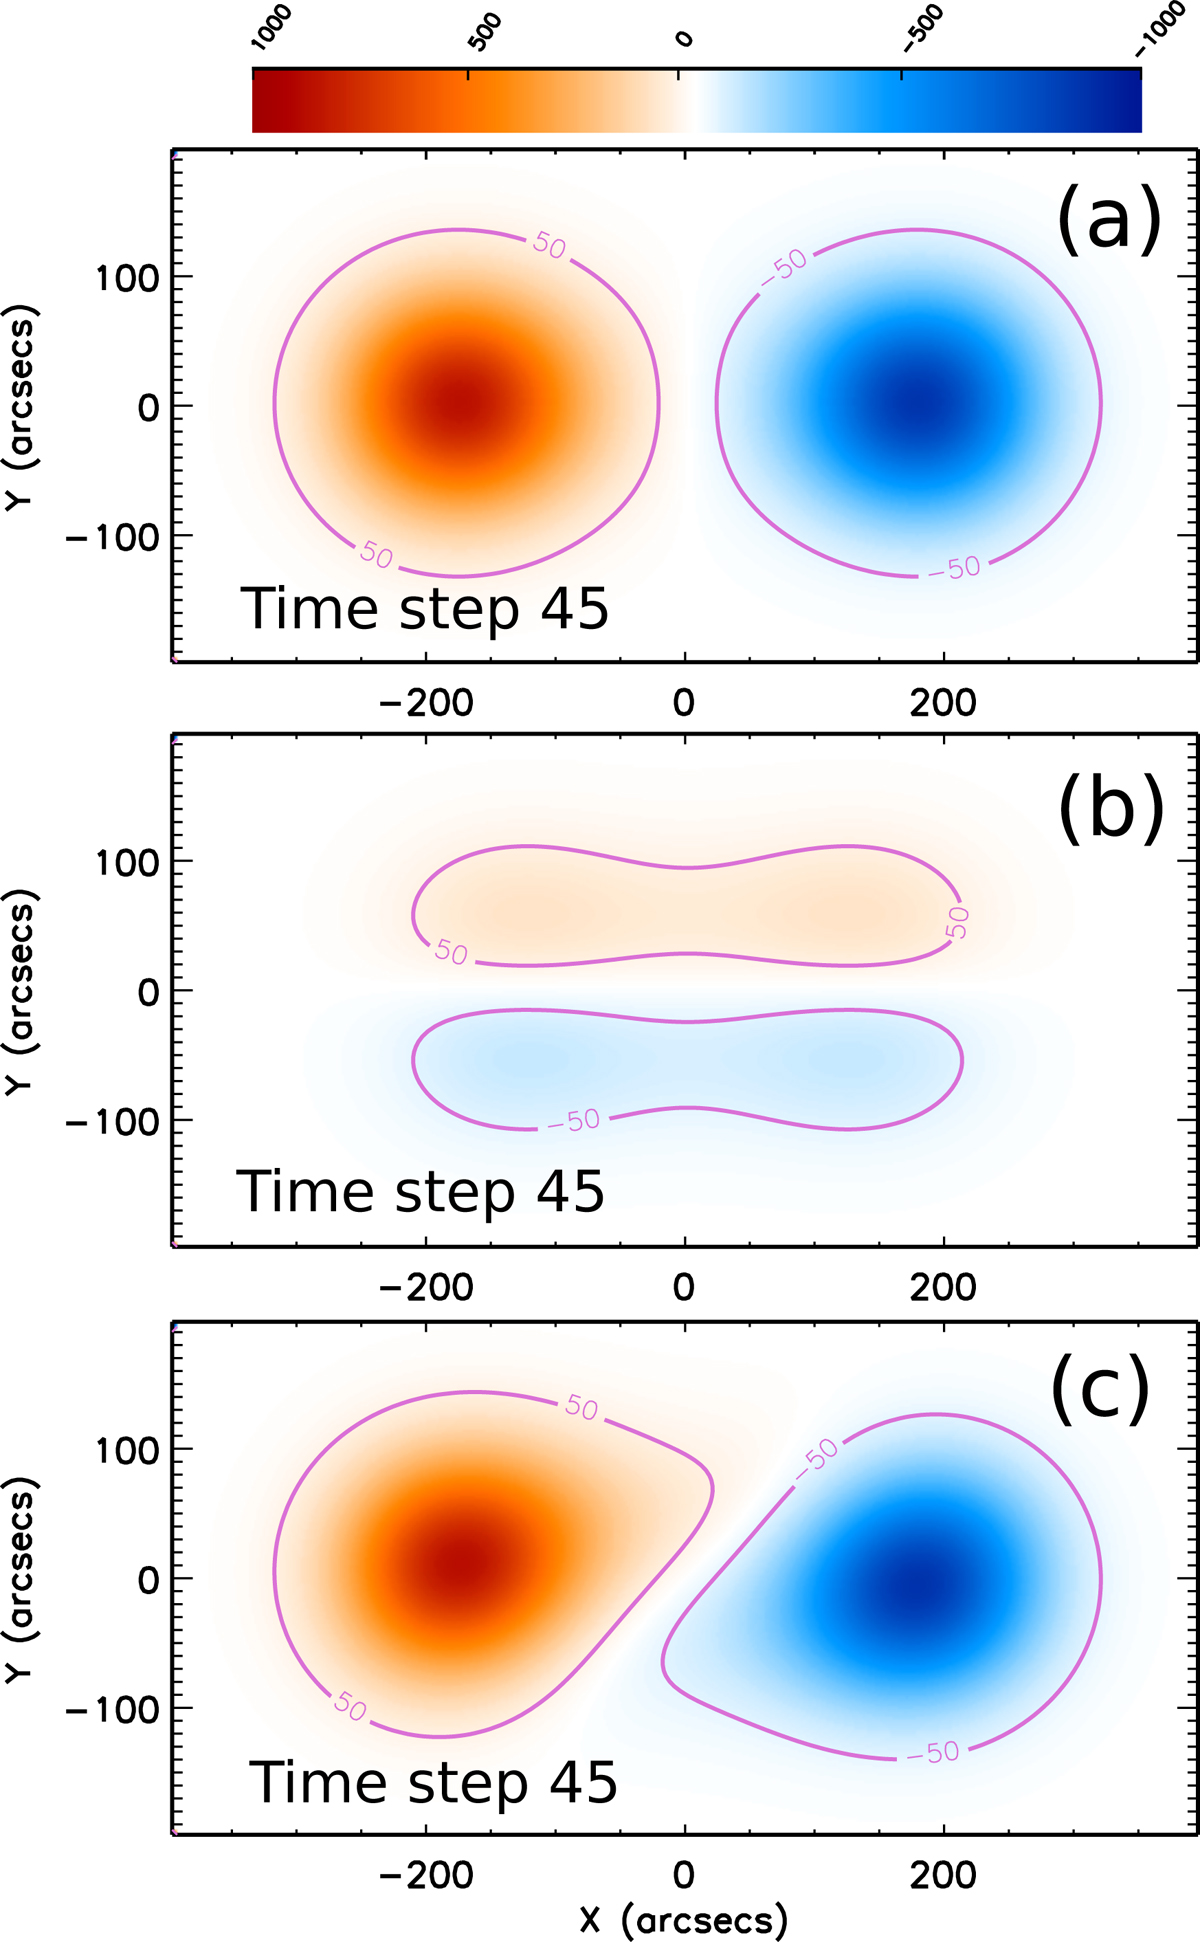
Synthetic magnetograms of the axial (a) and the azimuthal (b) magnetic field components of a uniformly twisted torus model with Nt, 0 = 0.5. (c) Total superposed magnetic field map. The red- and blue- shaded areas represent the positive and the negative value of Bz. The magenta contour in each map corresponds to |Bz| = 50 G (the maximum axial field is set to 1000 G). The associated movies are available online (fig1_a.avi, fig1_b.avi, and fig1_c.avi).
Current usage metrics show cumulative count of Article Views (full-text article views including HTML views, PDF and ePub downloads, according to the available data) and Abstracts Views on Vision4Press platform.
Data correspond to usage on the plateform after 2015. The current usage metrics is available 48-96 hours after online publication and is updated daily on week days.
Initial download of the metrics may take a while.