Fig. 7.
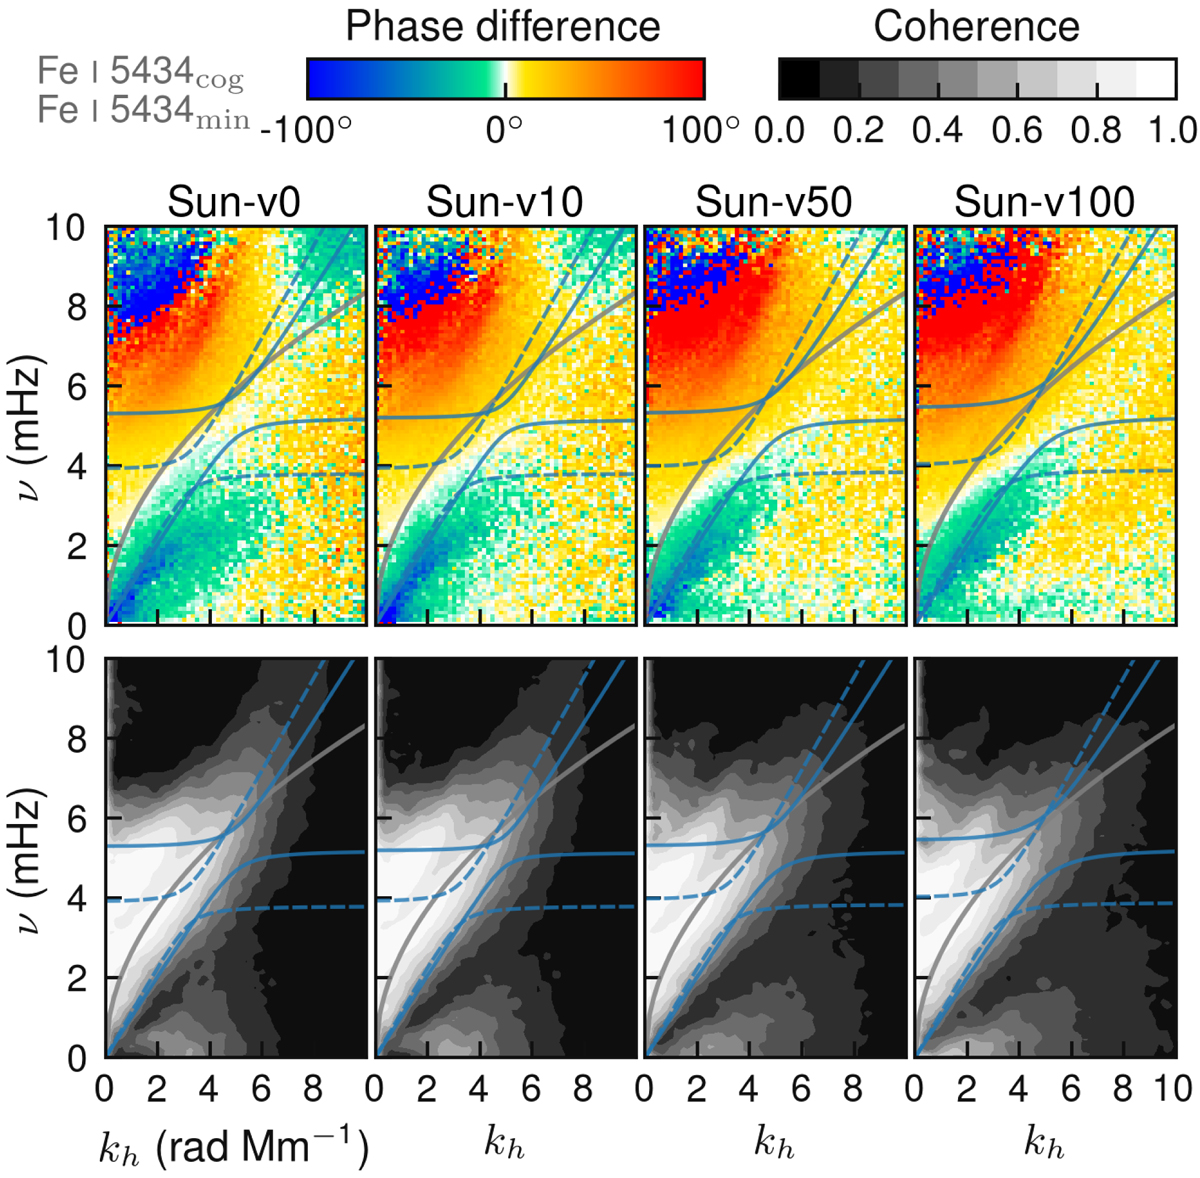
Phase difference (colour) and coherence (greyscale) spectra for Fe I λ 5434 Å line measured with the velocities derived using the COG and line-minima shifts. The grey curve marks the dispersion relation of the surface gravity waves. The blue curves mark the propagation boundary of the acoustic-gravity wave corresponding to the approximate formation heights where the COG (dashed) and line-minima (solid) velocities are measured.
Current usage metrics show cumulative count of Article Views (full-text article views including HTML views, PDF and ePub downloads, according to the available data) and Abstracts Views on Vision4Press platform.
Data correspond to usage on the plateform after 2015. The current usage metrics is available 48-96 hours after online publication and is updated daily on week days.
Initial download of the metrics may take a while.