Fig. 5.
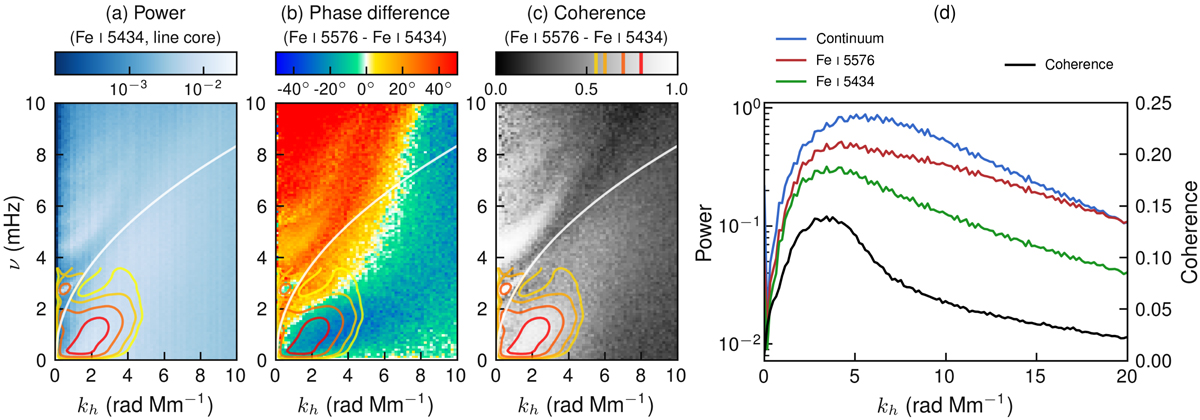
(a) Power in the kh − ω diagnostic diagram of the line core intensity of the Fe I λ 5434 Å line. The phase (b) and coherence (c) spectra between the line-core intensity of the Fe I λ 5576 Å and Fe I λ 5434 Å lines are also shown. The white line marks the dispersion relation of the surface gravity waves (f-mode). The coloured contour lines in (a)–(c) mark the coherence levels with the reference colours shown in the colourmap of (c). (d) Power as a function of kh integrated over the IGW region for the continuum intensity and line-core intensities of the Fe I λλ 5576 Å and 5434 Å lines. Also shown in black is the mean coherence in the IGW region.
Current usage metrics show cumulative count of Article Views (full-text article views including HTML views, PDF and ePub downloads, according to the available data) and Abstracts Views on Vision4Press platform.
Data correspond to usage on the plateform after 2015. The current usage metrics is available 48-96 hours after online publication and is updated daily on week days.
Initial download of the metrics may take a while.