Fig. 12.
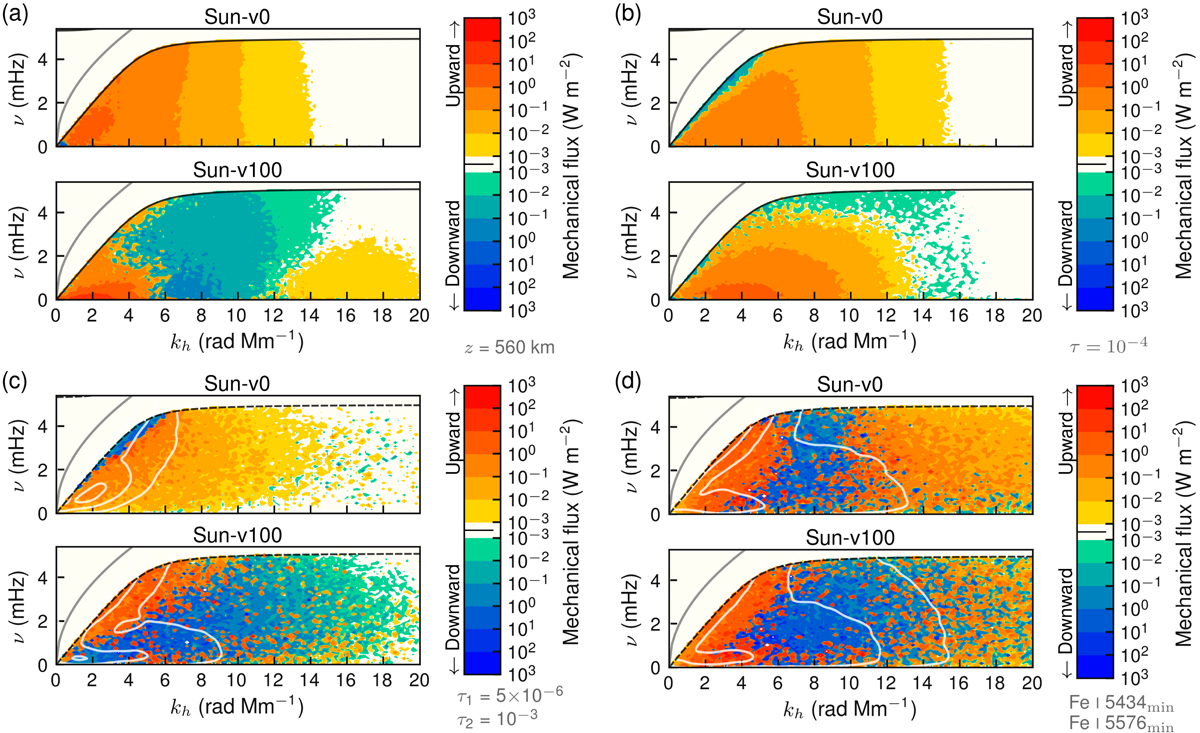
Vertical mechanical flux spectra at (a) a height of z = 560 km and at (b) the Rosseland mean optical depth layer of τR = 1 × 10⁻⁴. Also shown are the vertical energy flux spectra estimated from phase difference measurements of (c) velocities at two layers of constant optical depth: τR = 5 × 10⁻⁶ and τR = 1 × 10⁻³ and from (d) the line-minima shifts of the Fe I λ 5434 Å and Fe I λ 5576 Å lines. The plot is masked to show only the IGW region. The grey curve marks the dispersion relation of the surface gravity waves. The black dashed curves mark the propagation boundary of acoustic-gravity waves corresponding to approximately the middle region of the two layers.
Current usage metrics show cumulative count of Article Views (full-text article views including HTML views, PDF and ePub downloads, according to the available data) and Abstracts Views on Vision4Press platform.
Data correspond to usage on the plateform after 2015. The current usage metrics is available 48-96 hours after online publication and is updated daily on week days.
Initial download of the metrics may take a while.