Fig. 10.
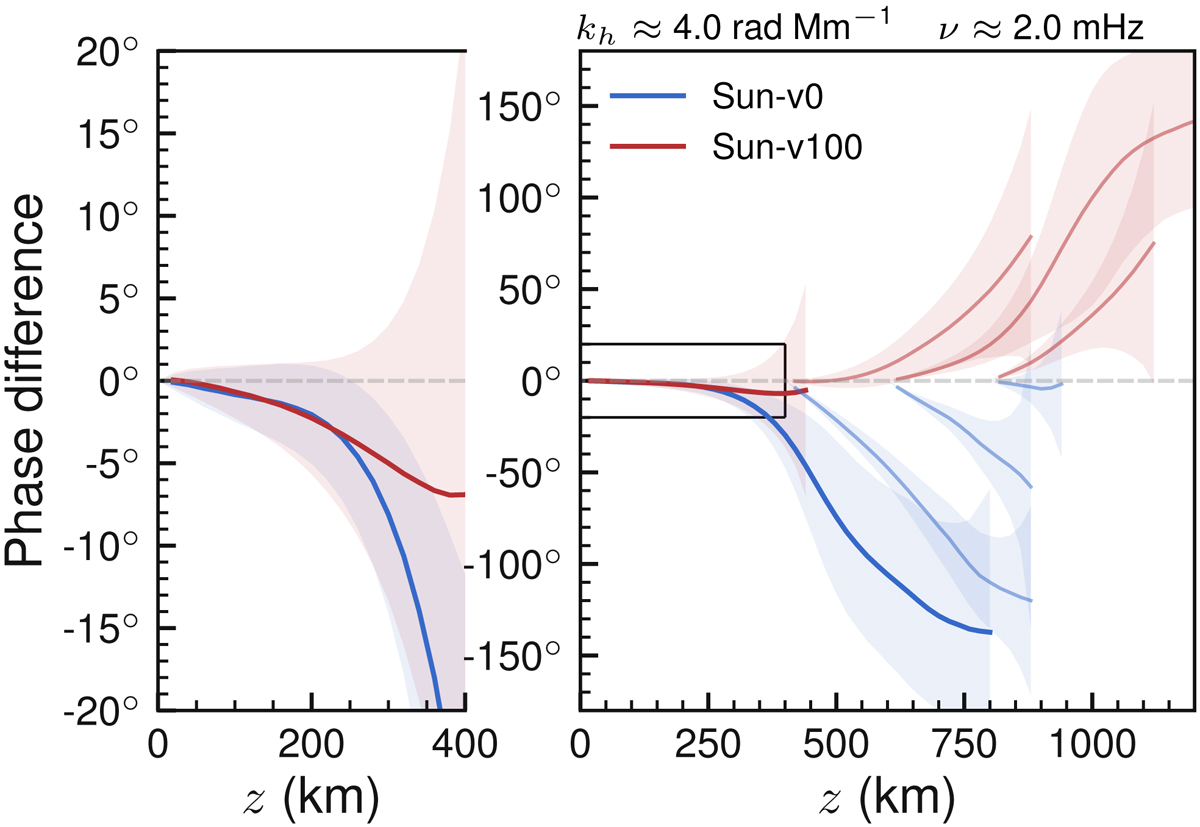
Phase difference between the reference layer, z = 0, and layers of constant geometrical scale for a given kh and ω (thick solid red and blue curves). The left plot is a rescaled part of the small region in the right plot. The thin solid lines show three other reference layers (z = 400,600,800 km). The 90% confidence bounds for the phase difference estimate is represented by the shaded area.
Current usage metrics show cumulative count of Article Views (full-text article views including HTML views, PDF and ePub downloads, according to the available data) and Abstracts Views on Vision4Press platform.
Data correspond to usage on the plateform after 2015. The current usage metrics is available 48-96 hours after online publication and is updated daily on week days.
Initial download of the metrics may take a while.