Fig. 1.
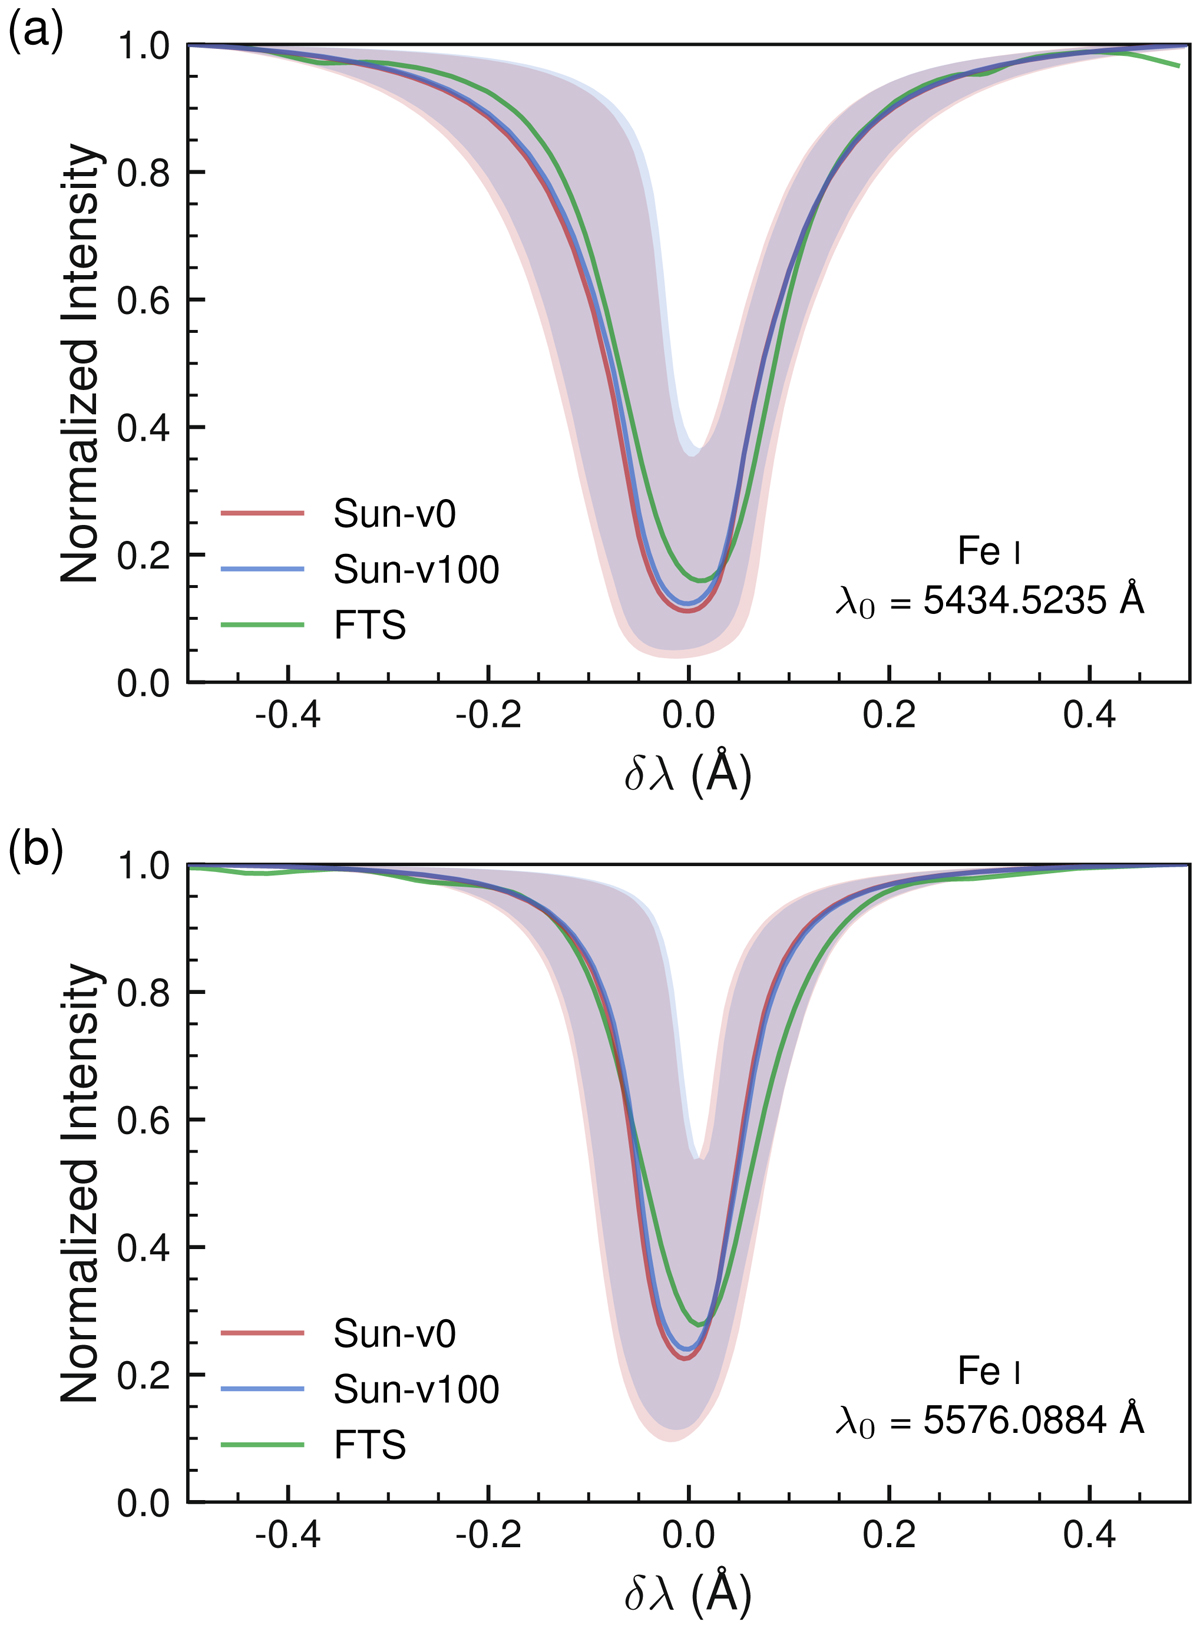
Median profile of (a) Fe I λ 5434 Å and (b) Fe I λ 5576 Å taken from a snapshot of the Sun-v0 (blue) and Sun-v100 (red) models. The FTS atlas spectra for the respective lines are shown in green. The background shaded region shows the 95% bounds of the line profiles over the whole computational domain in the selected snapshot.
Current usage metrics show cumulative count of Article Views (full-text article views including HTML views, PDF and ePub downloads, according to the available data) and Abstracts Views on Vision4Press platform.
Data correspond to usage on the plateform after 2015. The current usage metrics is available 48-96 hours after online publication and is updated daily on week days.
Initial download of the metrics may take a while.