Fig. 7
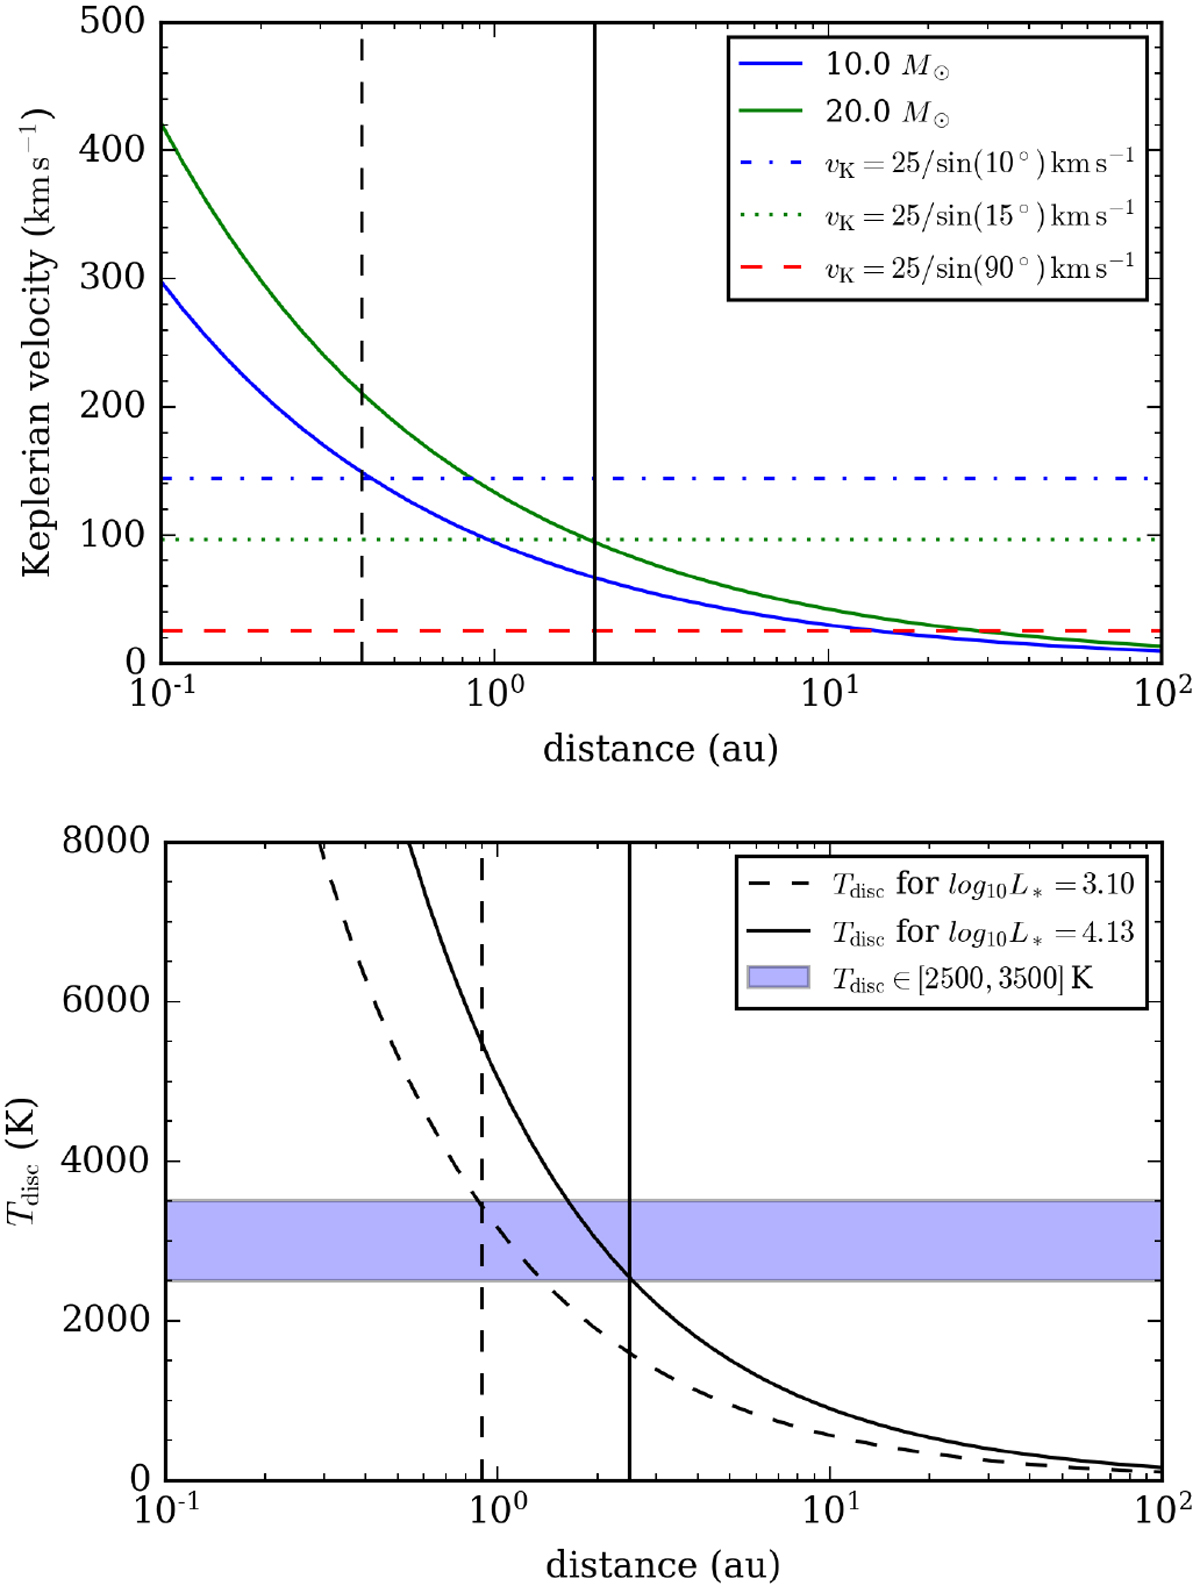
Top panel: Keplerian rotation vs. distance from the central source for a 10 M⊙ (blue solid curve) and 20 M⊙ (green solid curve) protostar. Dashed lines show the expected Keplerian velocity for i equals 10°, 15°, and 90° (blue, green, and red dashed line, respectively). Vertical lines at 0.4 au (dashed) and 2.0 au (solid) are drawn for reference where the lines intersect with the plausible inclination values. Bottom panel: disc temperature vs. distance from the central source for log10 L* = 3.10 (black dashed curve) and log10L* = 4.13 (black solid curve). Observed gas temperature range is indicated in purple. Vertical lines at 0.9 au (dashed) and 2.5 au (solid) are drawn for reference where the lines intersect with the plausible values in temperature.
Current usage metrics show cumulative count of Article Views (full-text article views including HTML views, PDF and ePub downloads, according to the available data) and Abstracts Views on Vision4Press platform.
Data correspond to usage on the plateform after 2015. The current usage metrics is available 48-96 hours after online publication and is updated daily on week days.
Initial download of the metrics may take a while.