Fig. 4
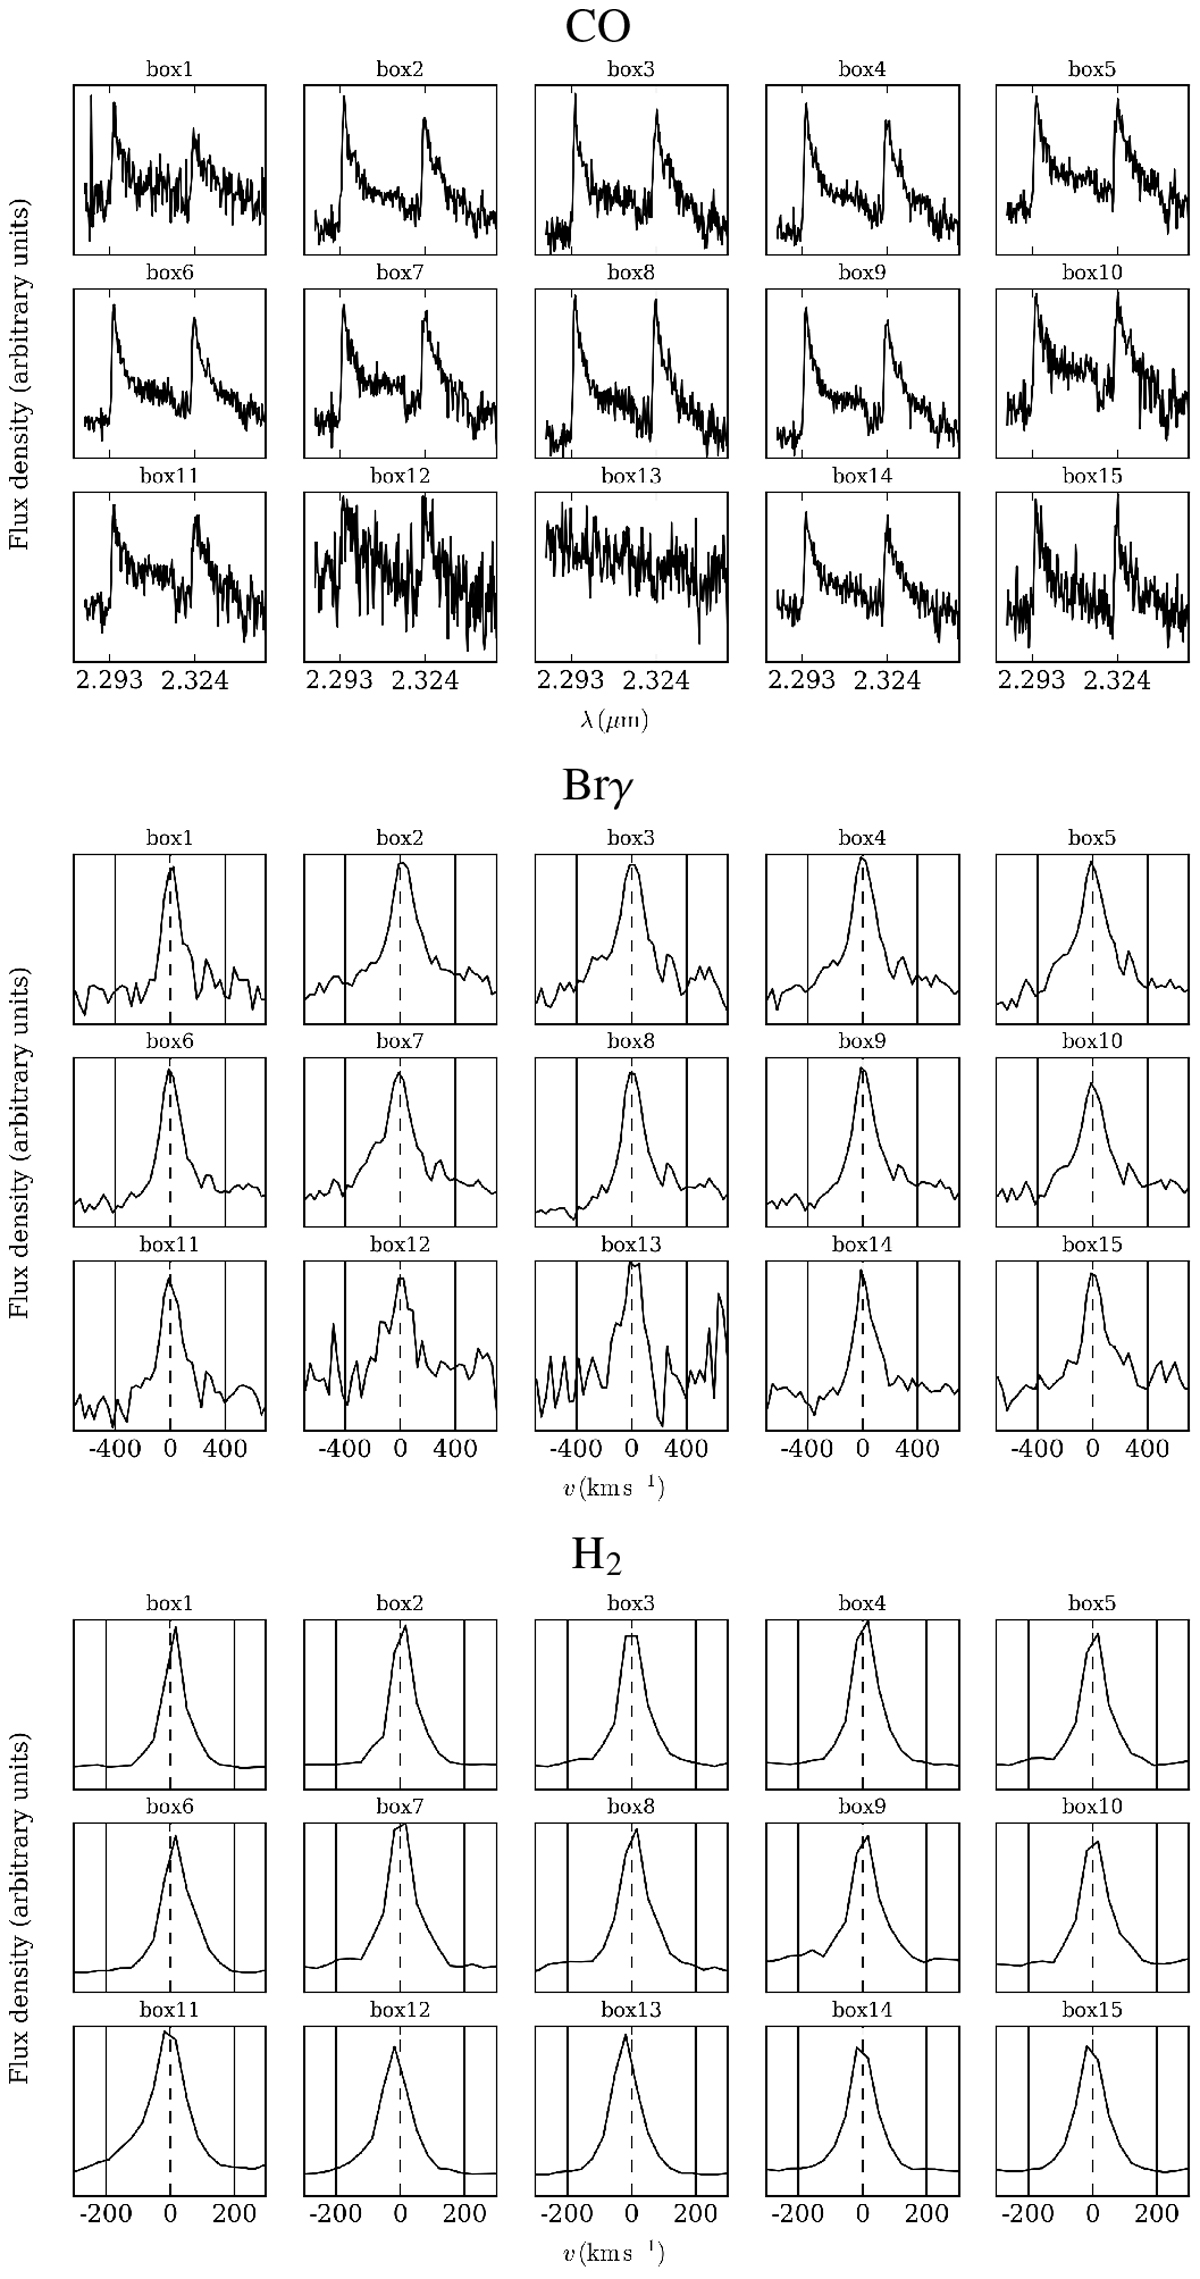
Top panel: spectra from VLT/SINFONI showing the profile variation of the two firsts CO bandhead lines along the cube. Middle panel: same as top panel for the Brγ line at 2.16 μm. Bottom panel: same as top panel for the H2 line 1− 0 S(1) at 2.12 μm. The box numbering corresponds to that given in Fig. 1. Velocities are given with respect to the LSR.
Current usage metrics show cumulative count of Article Views (full-text article views including HTML views, PDF and ePub downloads, according to the available data) and Abstracts Views on Vision4Press platform.
Data correspond to usage on the plateform after 2015. The current usage metrics is available 48-96 hours after online publication and is updated daily on week days.
Initial download of the metrics may take a while.