Fig. 3
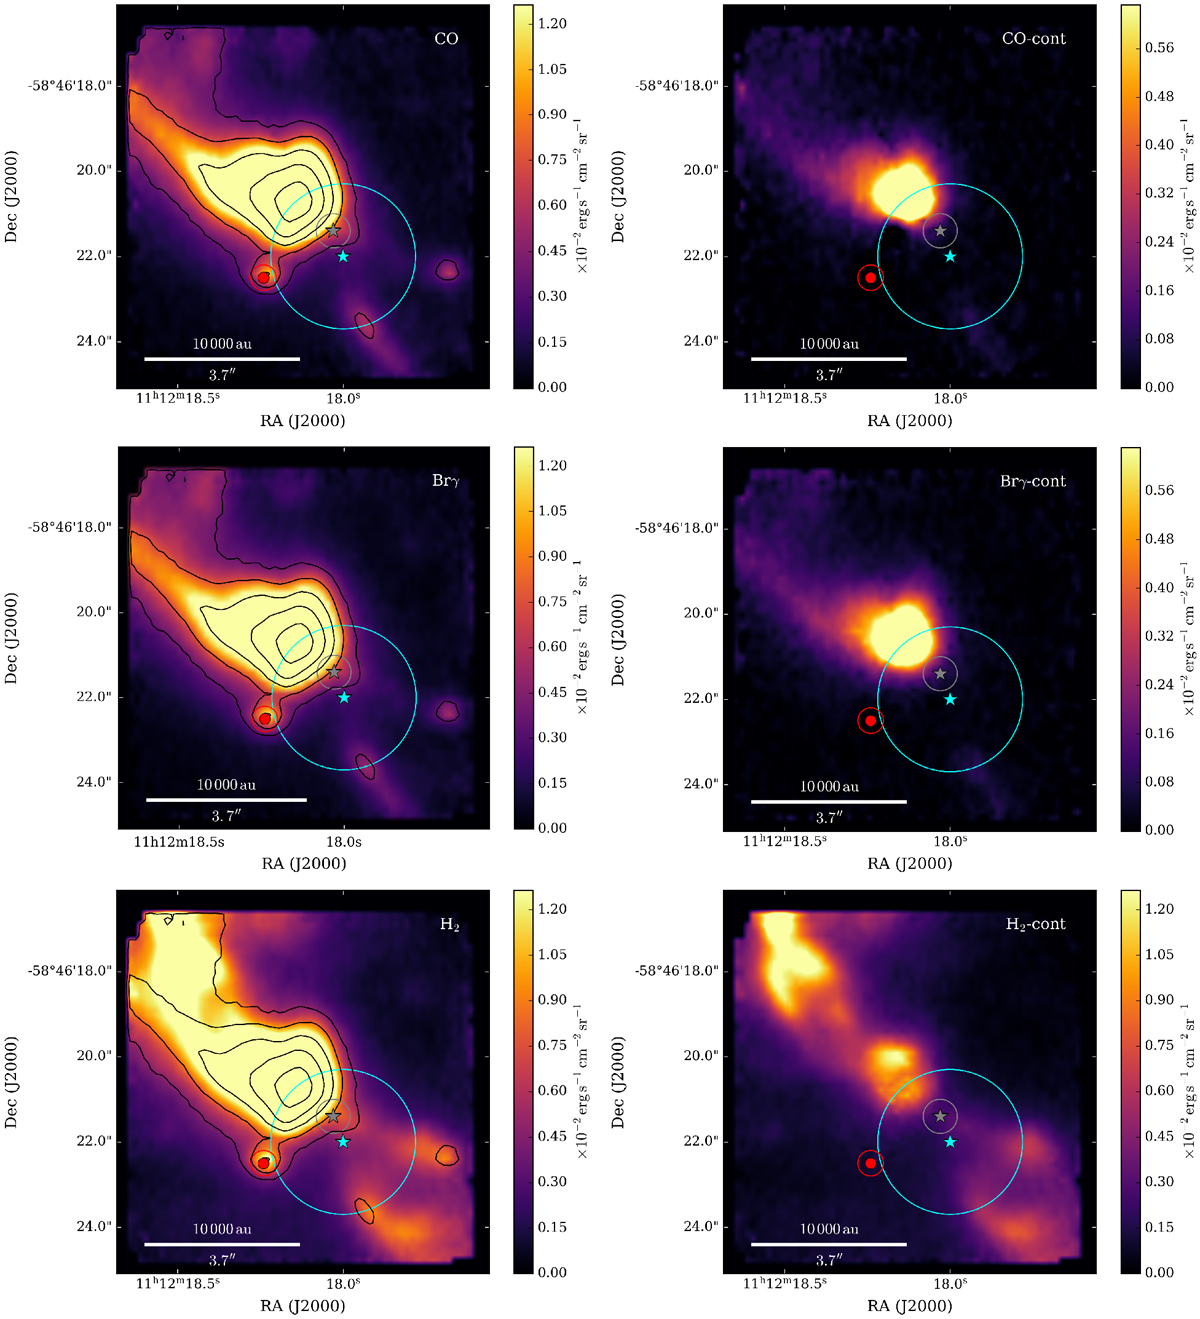
Emission maps from VLT/SINFONI for CO (top), Brγ (middle), and H2 (bottom), integrated over the peak of each line (Δλ ~ 0.00024 μm). Left panels: the black contour lines represent the continuum emission at 2.08559 μm, the levels are(5, 10, 20, 40, 80, 160) × σ where σ ~ 0.1 erg s−1 cm−2 μm−1 sr−1. Right panels: represent the continuum-subtracted emission maps, where the continuum subtraction was performed by considering the continuum left (blue-shifted) and right (red-shifted) of each emission line, with the exception of the CO, where only the left (blue-shifted) part was considered. The red circle represents the star in the Gaia DR2 catalogue (Source ID: 5339406246100053888, RA(J2000) = 11h12m18.24s, Dec(J2000) = −58d46m22.5s) used for accurate astrometry of our cubes (the circle around it represents the uncertainty ~ 0.3″). The cyan star represents the suggested position of the star given by Tamura et al. (1997); the circle around it represents the uncertainty ~1.7″. The grey star represents the position of the central source as given by our kinematic study (see Sect. 3.4). In all panels north is up and east is left.
Current usage metrics show cumulative count of Article Views (full-text article views including HTML views, PDF and ePub downloads, according to the available data) and Abstracts Views on Vision4Press platform.
Data correspond to usage on the plateform after 2015. The current usage metrics is available 48-96 hours after online publication and is updated daily on week days.
Initial download of the metrics may take a while.