Fig. C.1.
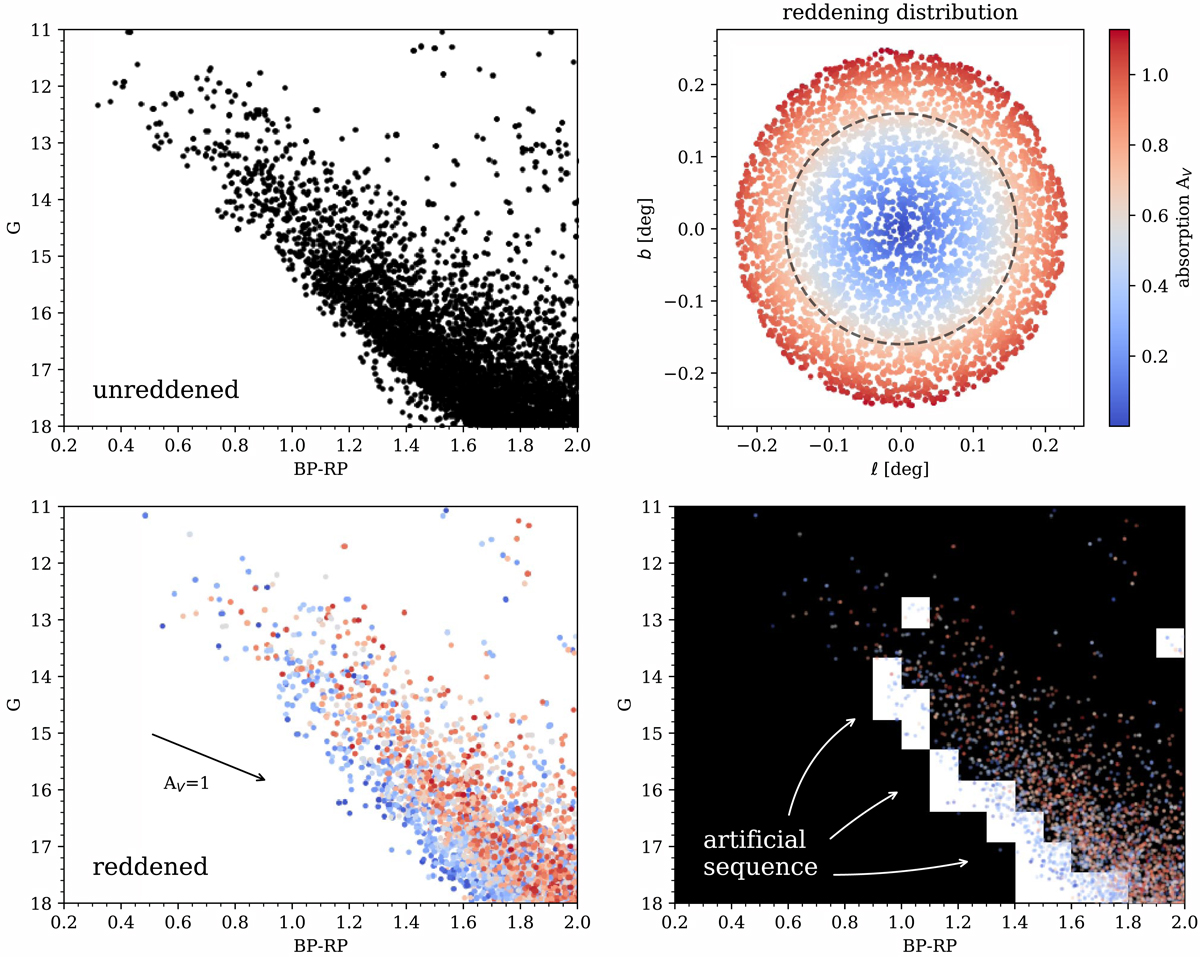
Top left: CMD of a simulated field population. Top right: spatial distribution of the reddening added the simulated field. The dashed line indicates the inner region. Bottom left: CMD after adding reddening. The arrow indicates AV = 1. Bottom right: bins marked in white correspond to areas where the inner region CMD is denser than the outer region CMD by more than two sigma (assuming Poisson noise).
Current usage metrics show cumulative count of Article Views (full-text article views including HTML views, PDF and ePub downloads, according to the available data) and Abstracts Views on Vision4Press platform.
Data correspond to usage on the plateform after 2015. The current usage metrics is available 48-96 hours after online publication and is updated daily on week days.
Initial download of the metrics may take a while.