Fig. 1.
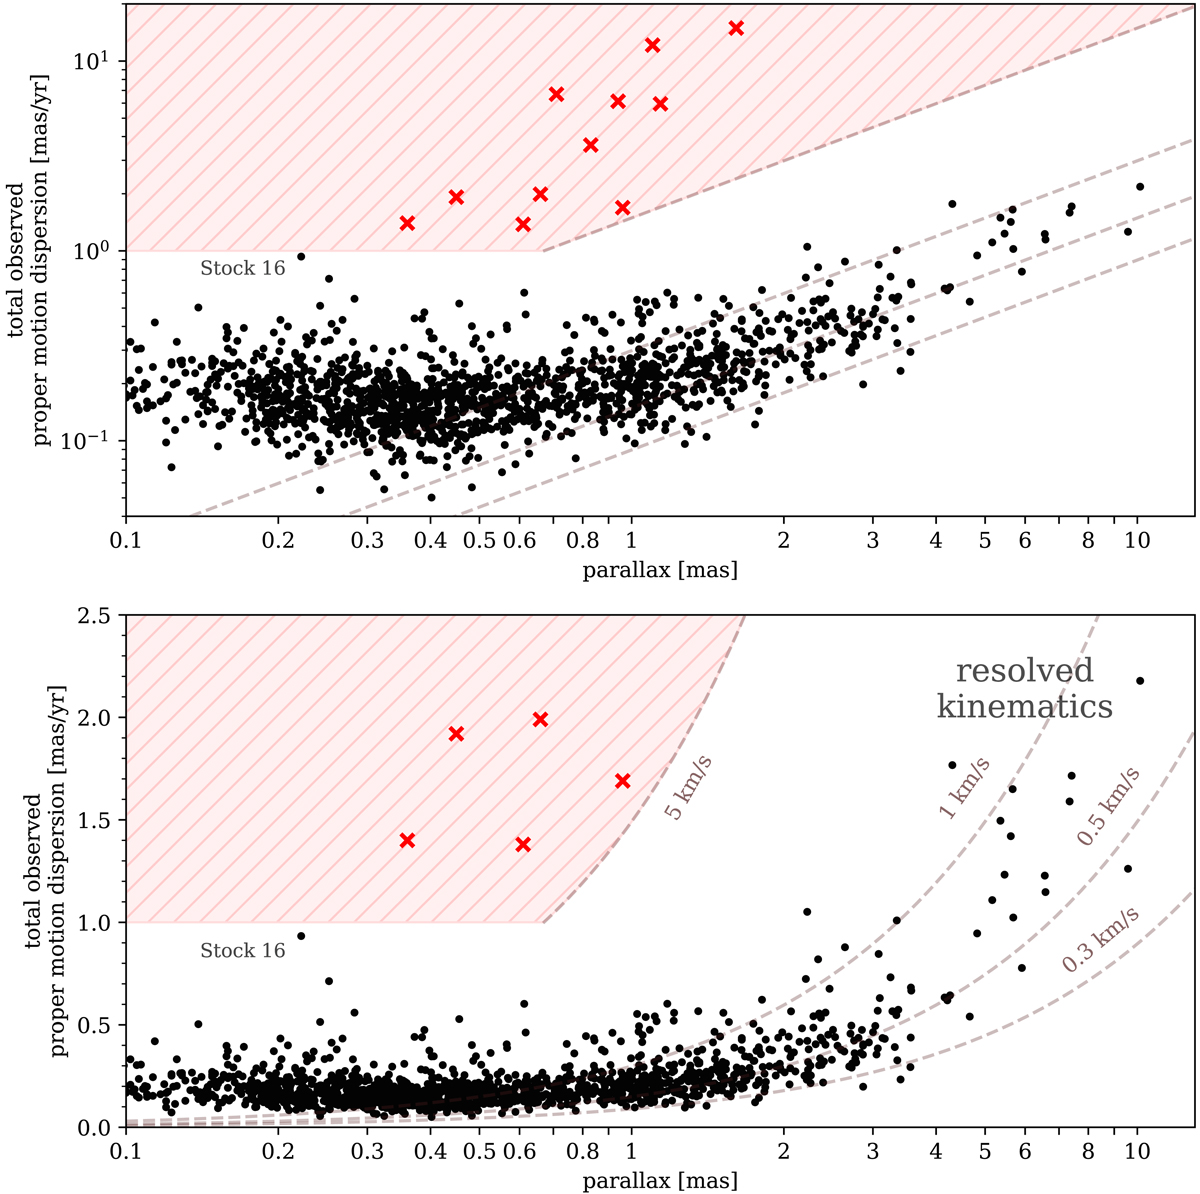
Top: total proper-motion dispersion against mean parallax for clusters identified in the Gaia DR2 data (blue dots) and the asterisms for which membership lists are available (red crosses). The dashed lines show the theoretical proper-motion dispersion corresponding to 1D velocity dispersions of 0.3, 0.5, 1, and 5 km s−1 in the absence of any measurement error. The shaded area indicates the region of the parameter space where we consider a group cannot be a physical cluster (see Sect. 3). Bottom: same as top, but with a decimal vertical scale.
Current usage metrics show cumulative count of Article Views (full-text article views including HTML views, PDF and ePub downloads, according to the available data) and Abstracts Views on Vision4Press platform.
Data correspond to usage on the plateform after 2015. The current usage metrics is available 48-96 hours after online publication and is updated daily on week days.
Initial download of the metrics may take a while.