Fig. 2.
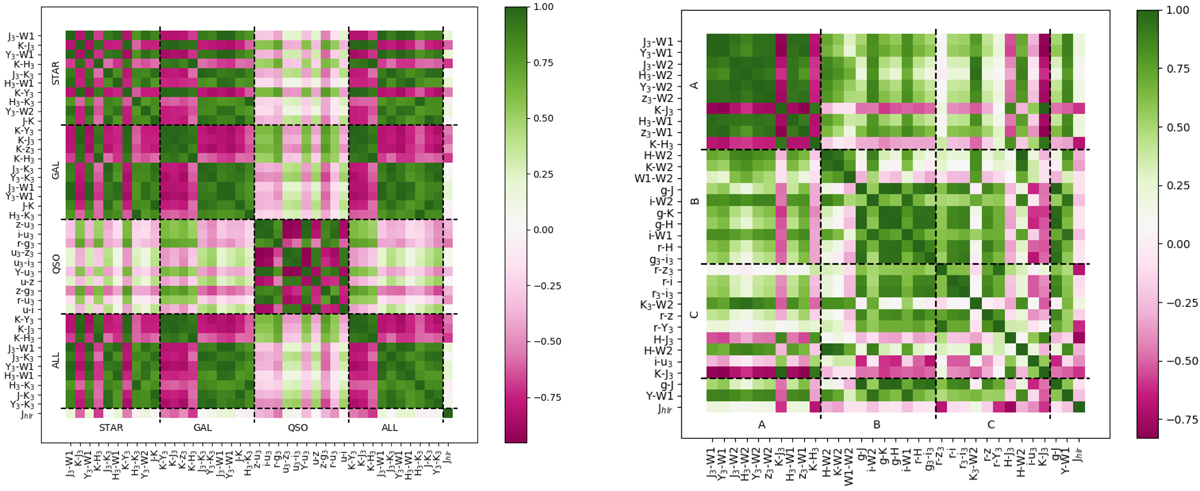
Left: correlation matrix for the top 10 attributes from the three RF binary label and one multi-label output, and the Jhlr attribute. The STAR, GAL, QSO, ALL labels show the top 10 attributes grouped together for the different RF setups (explained in Sect. 4.2.2). Right: correlation matrix for the top 10 attributes from the three classifiers A, B and C from FP18, the colours g − J and Y − W1, and the Jhlr attribute. The A, B, C labels show the top 10 attributes grouped together for the classifiers A, B and C from FP18.
Current usage metrics show cumulative count of Article Views (full-text article views including HTML views, PDF and ePub downloads, according to the available data) and Abstracts Views on Vision4Press platform.
Data correspond to usage on the plateform after 2015. The current usage metrics is available 48-96 hours after online publication and is updated daily on week days.
Initial download of the metrics may take a while.