Free Access
Fig. 16.
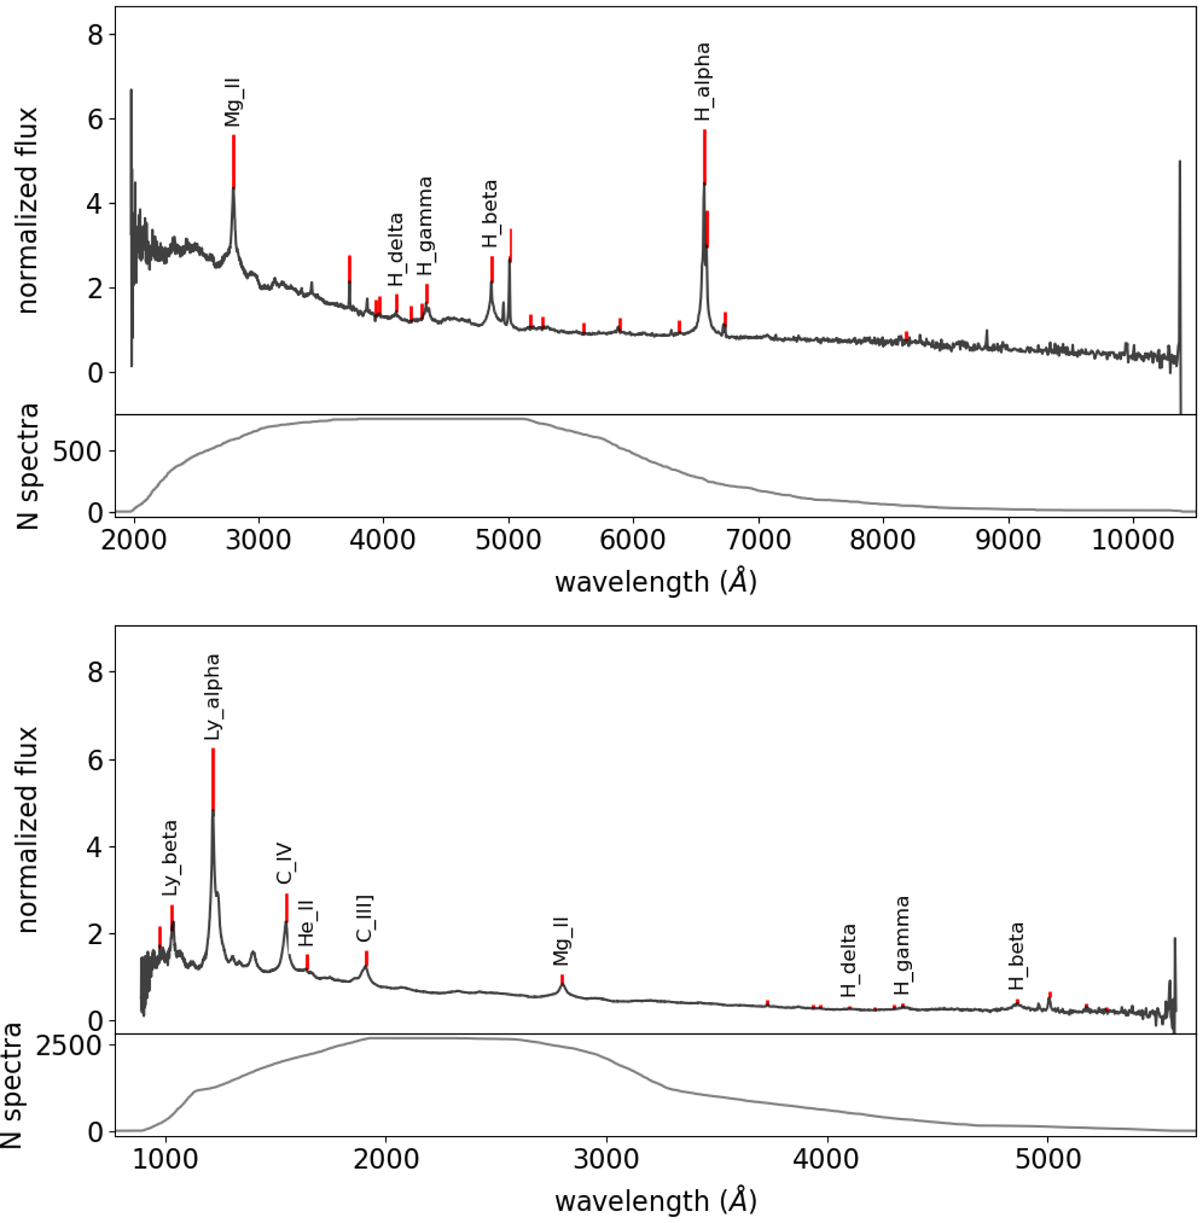
SDSS DR14 median stacked spectrum of HDBSCAN identified QSO. Top: sources at 0 < z < 0.8, normalized at rest-frame 5100 Å. Bottom: sources at 0.8 < z < 3 normalized at 1925 Å. The lower subplot shows the number of stacked spectra per pixel.
Current usage metrics show cumulative count of Article Views (full-text article views including HTML views, PDF and ePub downloads, according to the available data) and Abstracts Views on Vision4Press platform.
Data correspond to usage on the plateform after 2015. The current usage metrics is available 48-96 hours after online publication and is updated daily on week days.
Initial download of the metrics may take a while.