Fig. 14.
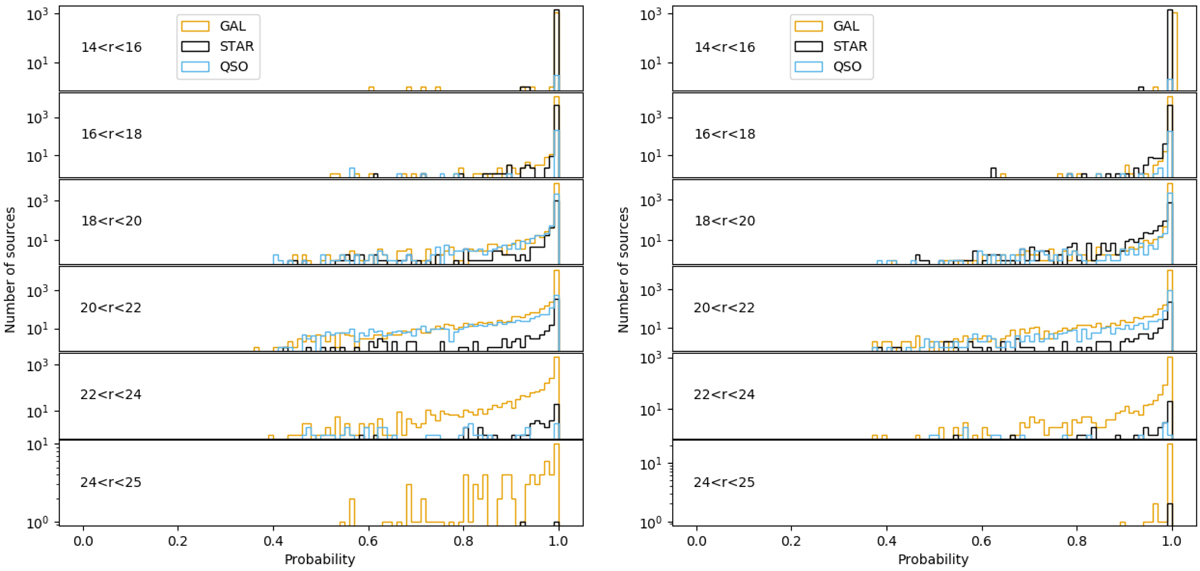
Probability distributions for the CPz sample for six different r magnitude bins are shown. The classification probability of each object is obtained using the “highest-probability” method (see Sect. 5.3). The left panel is for when just colours were used as attributes, and the right panel is for when both colour and HLR information were used as attributes. The objects are in classes according to their “highest-probability” final label.
Current usage metrics show cumulative count of Article Views (full-text article views including HTML views, PDF and ePub downloads, according to the available data) and Abstracts Views on Vision4Press platform.
Data correspond to usage on the plateform after 2015. The current usage metrics is available 48-96 hours after online publication and is updated daily on week days.
Initial download of the metrics may take a while.