Free Access
Fig. A.3
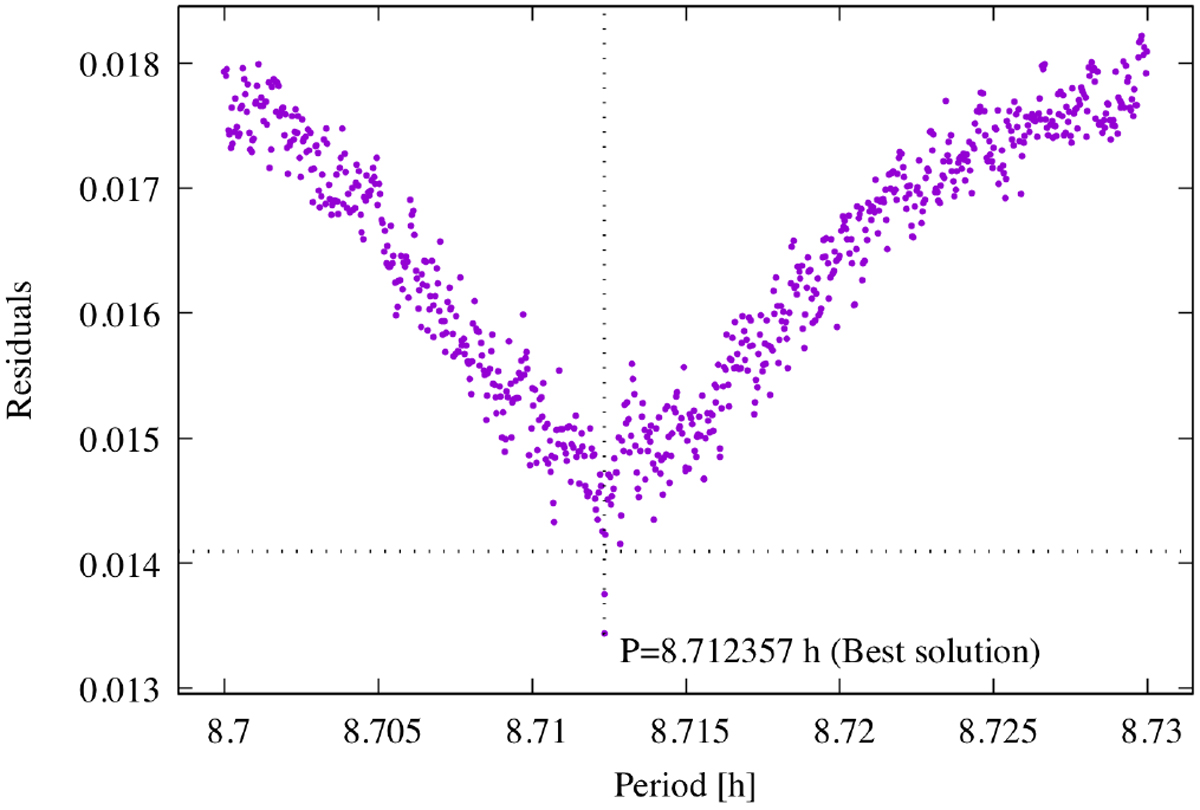
Periodogram for Interamnia: each point corresponds to a local minimum in the parameter space. The point with the lowest rms is the global minimum and the horizontal line indicates the rms threshold as defined in Hanuš et al. (2018).
Current usage metrics show cumulative count of Article Views (full-text article views including HTML views, PDF and ePub downloads, according to the available data) and Abstracts Views on Vision4Press platform.
Data correspond to usage on the plateform after 2015. The current usage metrics is available 48-96 hours after online publication and is updated daily on week days.
Initial download of the metrics may take a while.