Free Access
Fig. 5.
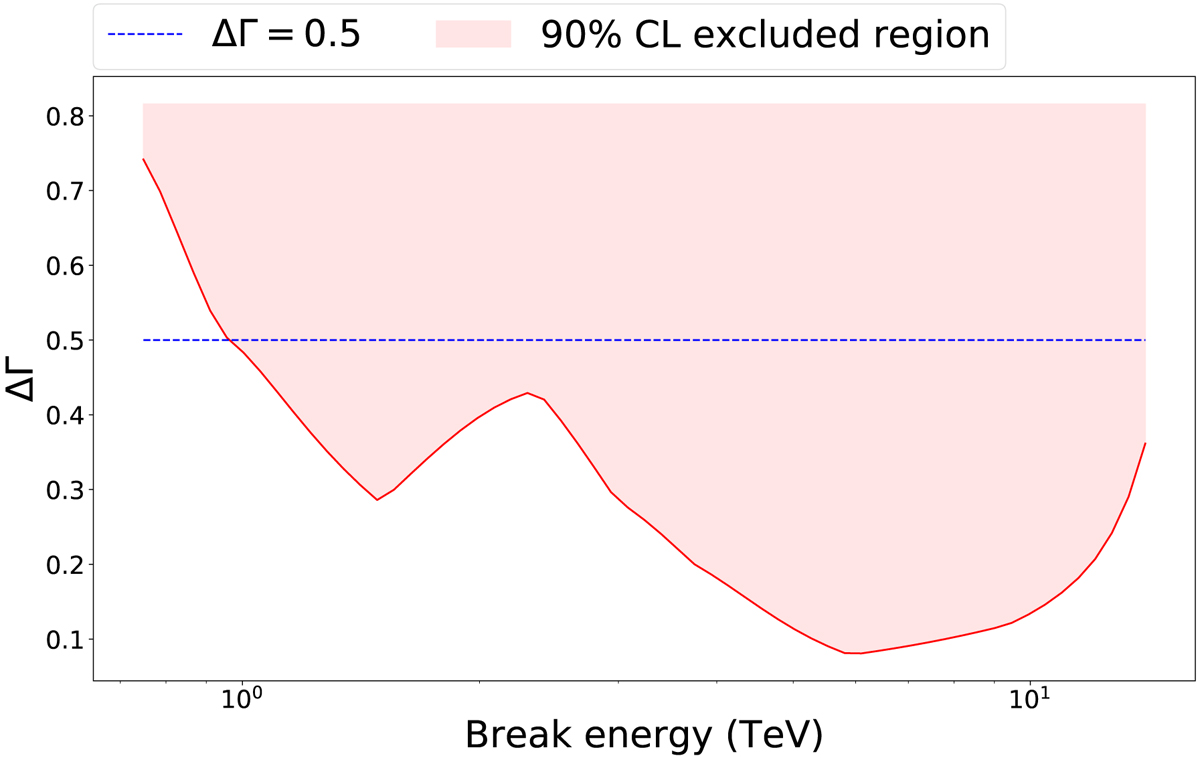
Upper limit on a break in the power-law spectrum by ΔΓ as a function of the break energy. Shown as red line is the 90% CL upper limit on ΔΓ derived from the combined data discussed in Sect. 6.
Current usage metrics show cumulative count of Article Views (full-text article views including HTML views, PDF and ePub downloads, according to the available data) and Abstracts Views on Vision4Press platform.
Data correspond to usage on the plateform after 2015. The current usage metrics is available 48-96 hours after online publication and is updated daily on week days.
Initial download of the metrics may take a while.