Fig. 4.
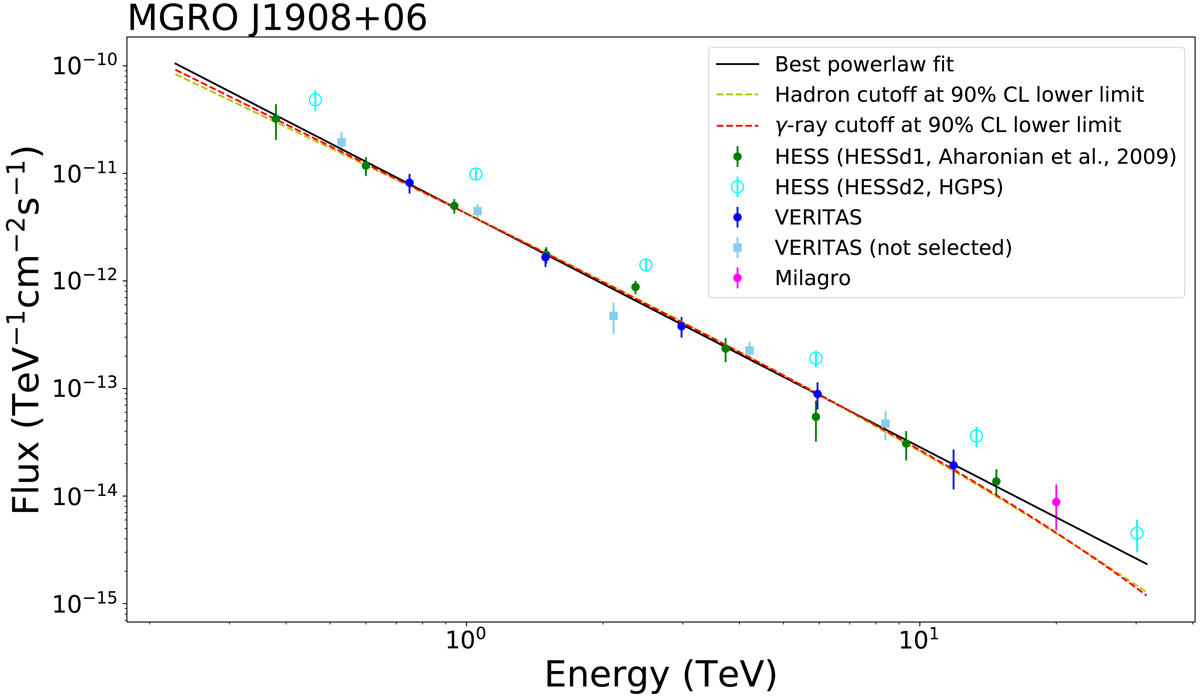
Spectral γ-ray data for the source MGRO J1908+06. Shown as green circles are the HESS data from Aharonian et al. (2009b). Shown in cyan open circles are the spectral data from the HGPS. Blue spectral points are from VERITAS (Aliu et al. 2014). VERITAS data marked with a square are not selected for the analysis to avoid correlations between spectral points. The Milagro data point is from Abdo et al. (2007). Shown in black, yellow, and red are best fits to all datapoints indicated by filled circles. The black line is a fit to a power-law model. Yellow and red lines are best fits to a power-law model with cutoff at the 90% CL lower limits Ecut, γ = 29.5 TeV (yellow) and Ecut, h = 141.5 TeV (red).
Current usage metrics show cumulative count of Article Views (full-text article views including HTML views, PDF and ePub downloads, according to the available data) and Abstracts Views on Vision4Press platform.
Data correspond to usage on the plateform after 2015. The current usage metrics is available 48-96 hours after online publication and is updated daily on week days.
Initial download of the metrics may take a while.