Free Access
Fig. 6
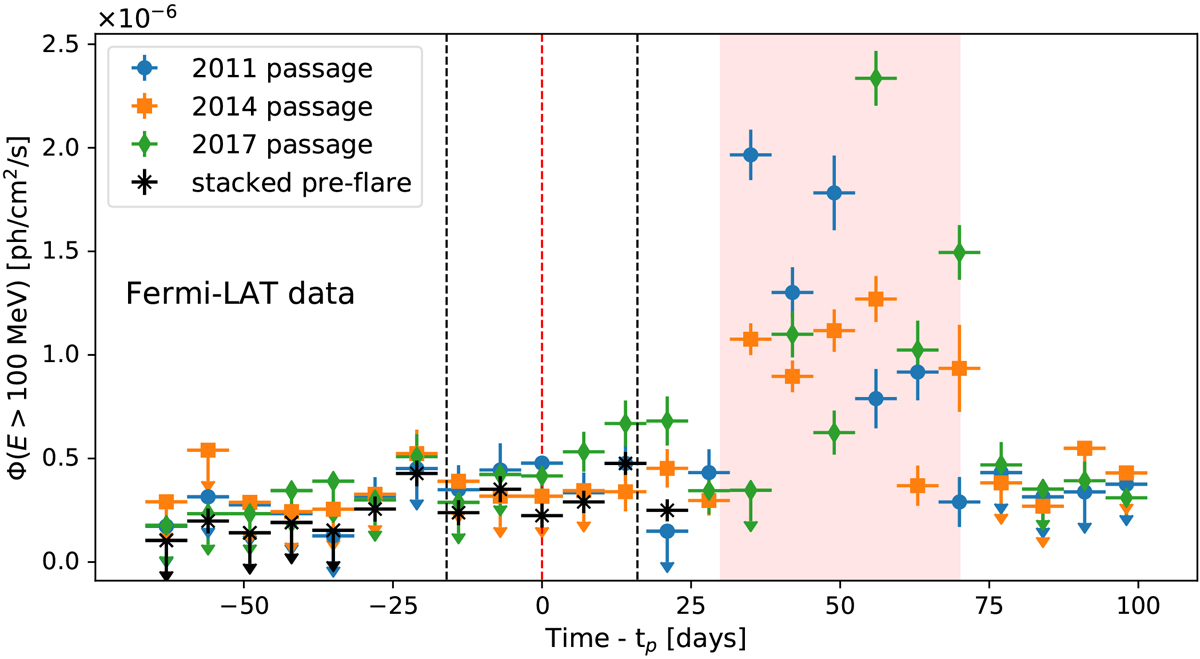
Light curves derived from Fermi-LAT data for the periastron passages 2010/11 (blue circles), 2014 (orange squares), 2017 (green diamonds), and the stacked analysis of all the data in the pre-flare phases (black crosses). Vertical dashed lines and the red-shaded area are defined as in Fig. 3.
Current usage metrics show cumulative count of Article Views (full-text article views including HTML views, PDF and ePub downloads, according to the available data) and Abstracts Views on Vision4Press platform.
Data correspond to usage on the plateform after 2015. The current usage metrics is available 48-96 hours after online publication and is updated daily on week days.
Initial download of the metrics may take a while.