Fig. 5
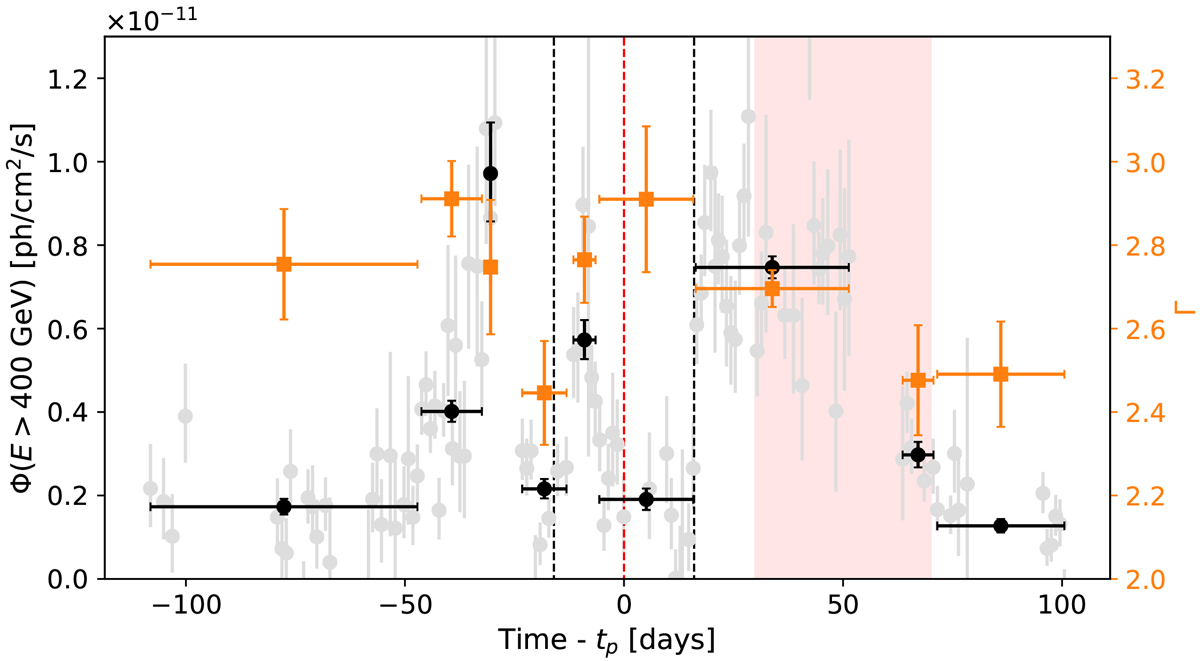
Integral flux above 400 GeV (Φ>400 GeV; black circles) and photon indices (Γ; orange squares) obtained from a stacked analysis of data corresponding to selected time intervals summarised in Table 3. The light grey points correspond to the nightwise-binned phase-folded flux from which the Bayesian Blocks were computed. Vertical dashed lines and the red-shaded area are defined as in Fig. 3.
Current usage metrics show cumulative count of Article Views (full-text article views including HTML views, PDF and ePub downloads, according to the available data) and Abstracts Views on Vision4Press platform.
Data correspond to usage on the plateform after 2015. The current usage metrics is available 48-96 hours after online publication and is updated daily on week days.
Initial download of the metrics may take a while.