Fig. 4
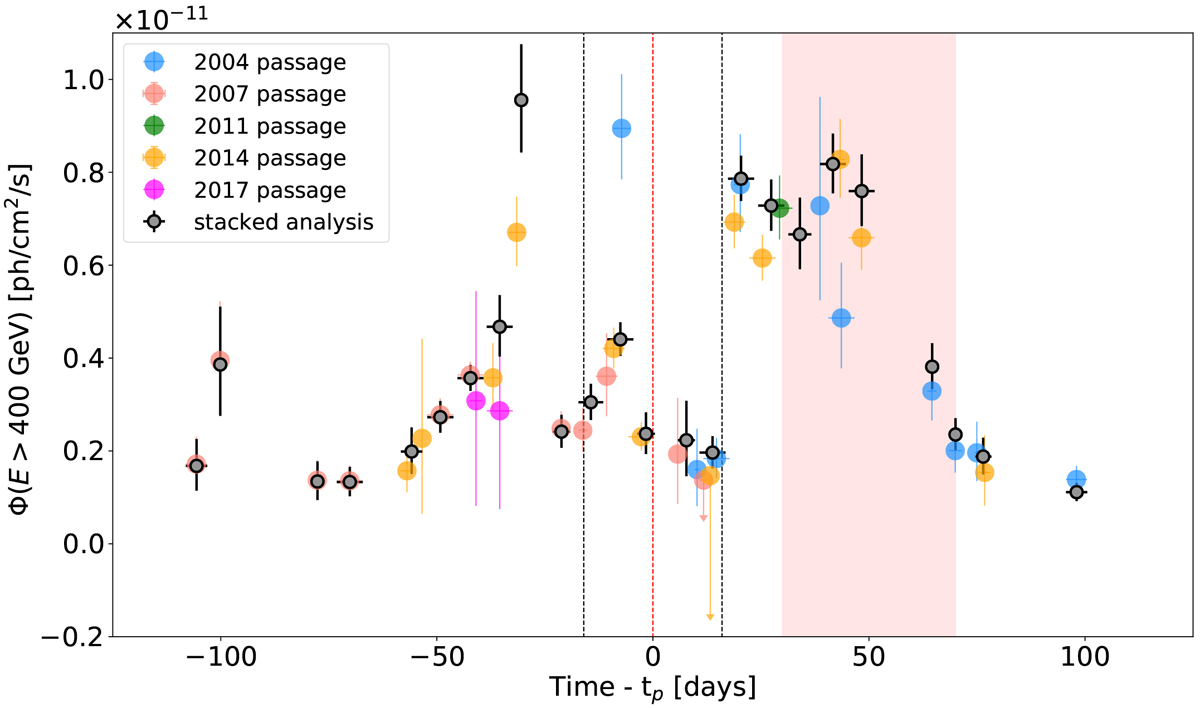
Weekly-binned light curves of the 2004, 2007, 2011, 2014 and 2017 periastron passages. Data from 2004 to 2011 have been reanalysed using the latest software available (the same as the one used for the 2014 analysis). A stacked light curve for all periastron passages in time bins corresponding to one week is also shown, with flux points derived assuming a photon index of 2.7 for all analyses. Downward arrows are 68% confidence level upper limits. Vertical dashed lines and the red-shaded area are defined as in Fig. 3.
Current usage metrics show cumulative count of Article Views (full-text article views including HTML views, PDF and ePub downloads, according to the available data) and Abstracts Views on Vision4Press platform.
Data correspond to usage on the plateform after 2015. The current usage metrics is available 48-96 hours after online publication and is updated daily on week days.
Initial download of the metrics may take a while.