Fig. 3
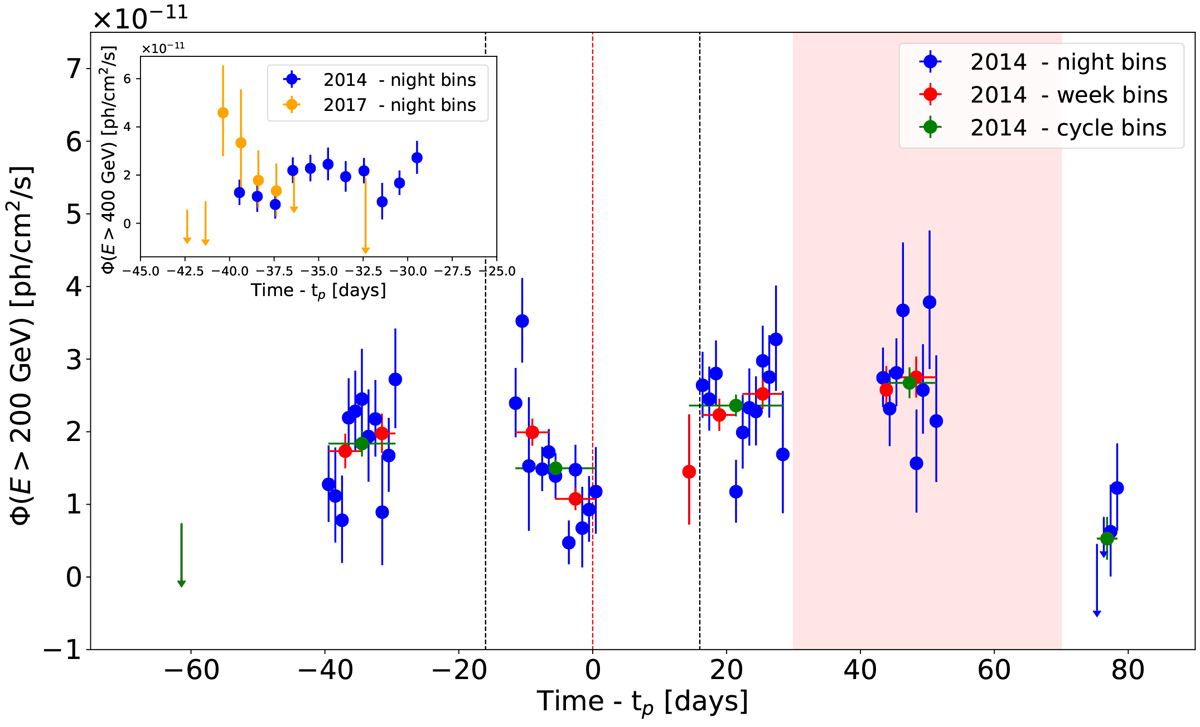
Light curve corresponding to the 2014 periastron passage recorded with CT5 mono configuration. Integral fluxes above 200 GeV are displayed. Three different time binnings have been studied: days (blue), weeks (red) and observing periods (given by moon cycles of 28 d, in green). Downward arrows are 68% confidence level upper limits. Vertical dashed lines indicate the times of the disc crossings (grey) and the time of periastron tp (red). The red-shaded band indicates the period in which the HE gamma-ray flares have been reported in 2014. In the inset, the CT5 mono light curves obtained in 2014 and 2017 are shown above energies of 400 GeV. The time range is limited to the part of the orbit sampled in 2017. In case of the 2017 light curve, a photon index of 2.7 is assumed.
Current usage metrics show cumulative count of Article Views (full-text article views including HTML views, PDF and ePub downloads, according to the available data) and Abstracts Views on Vision4Press platform.
Data correspond to usage on the plateform after 2015. The current usage metrics is available 48-96 hours after online publication and is updated daily on week days.
Initial download of the metrics may take a while.