Fig. 2
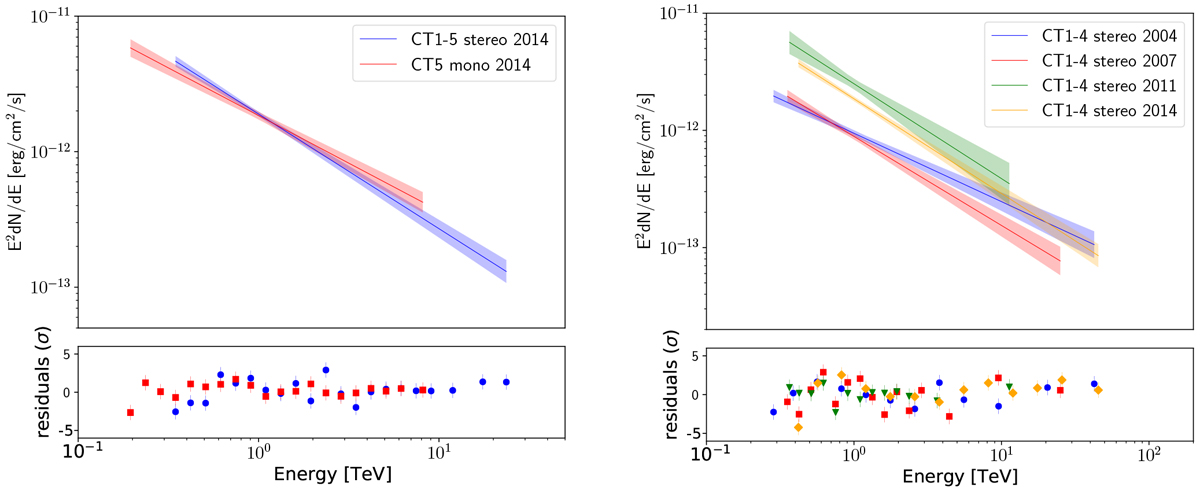
Spectral energy distribution of gamma rays from PSR B1259–63/LS 2883. Left: results obtained from the observation campaign in 2014, with two different instrument configurations: CT5 mono and CT1–5 stereo, shown in red and blue, respectively. Right: results from observation campaigns in 2004, 2007, 2011 and 2014 in CT1–4 stereo mode. Spectral energy bins are defined such that flux points have a statistical significance above 2σ in all cases. The highest-energy flux point of the 2014 spectrum is significant at the 1.5σ level only. Upper panels: best power-law fit to the data, with coloured bands indicating the 1σ statistical uncertainties on these fits. Lower panels: residuals of actual data to the best spectral fit. See main text for details.
Current usage metrics show cumulative count of Article Views (full-text article views including HTML views, PDF and ePub downloads, according to the available data) and Abstracts Views on Vision4Press platform.
Data correspond to usage on the plateform after 2015. The current usage metrics is available 48-96 hours after online publication and is updated daily on week days.
Initial download of the metrics may take a while.