Fig. 7.
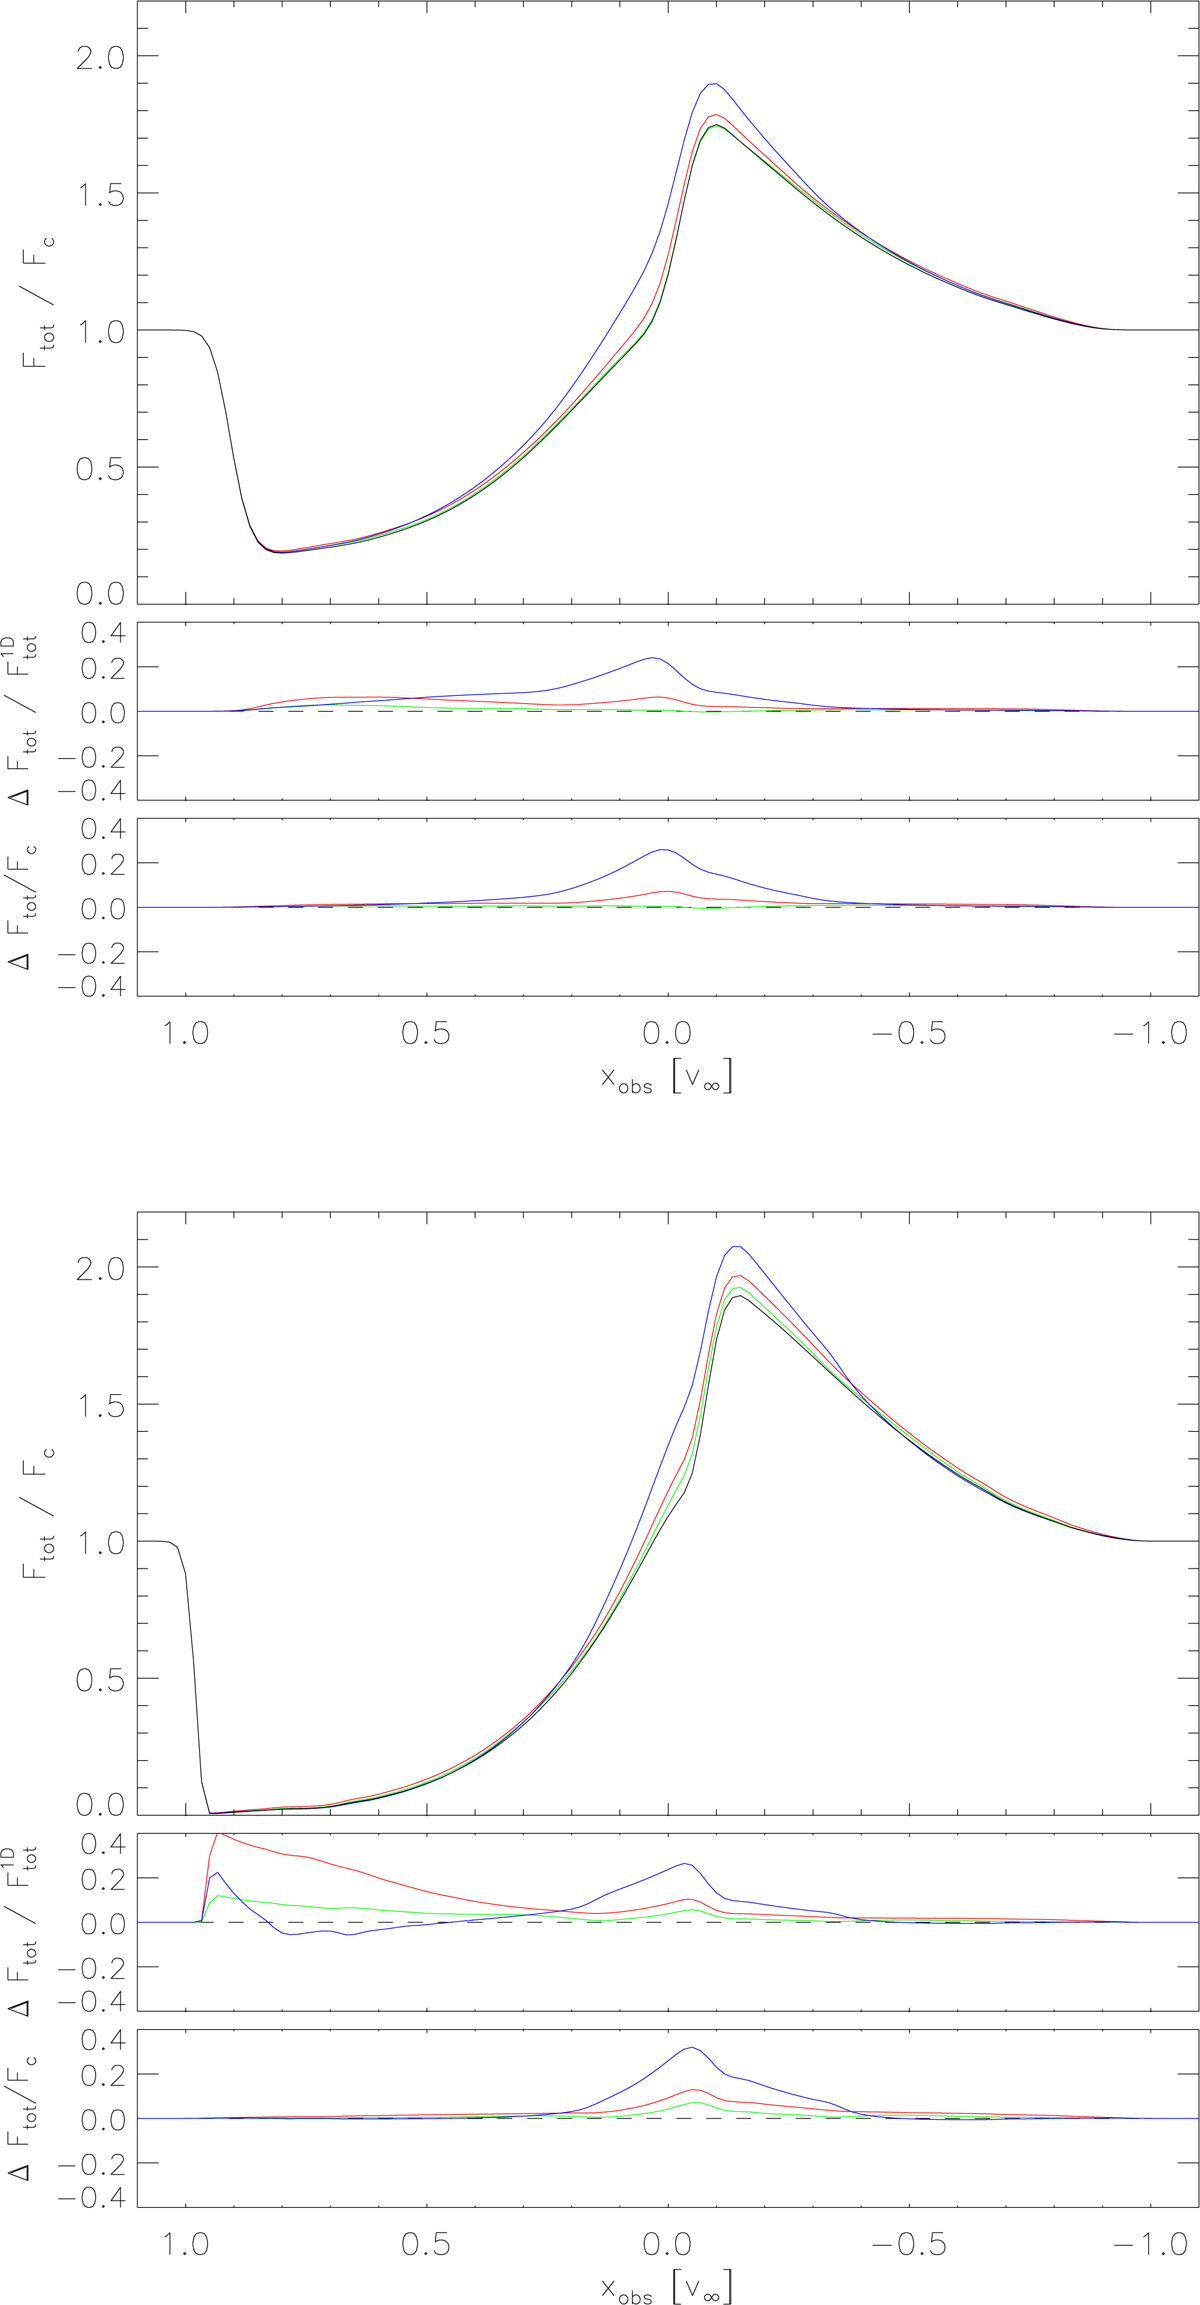
Emergent flux profiles of an intermediate (kL = 103, top panel) and strong (kL = 105, bottom panel) line. The blue, red, and green curves correspond to the solution of the FVM, SClin, and SCbez methods, respectively. The reference profile (black solid line) has been derived from the “exact” 1D source function interpolated onto the 3D Cartesian grid. Corresponding relative and absolute errors are shown at the bottom of each chart. For all profiles, the continuum level has been determined from a zero-opacity model.
Current usage metrics show cumulative count of Article Views (full-text article views including HTML views, PDF and ePub downloads, according to the available data) and Abstracts Views on Vision4Press platform.
Data correspond to usage on the plateform after 2015. The current usage metrics is available 48-96 hours after online publication and is updated daily on week days.
Initial download of the metrics may take a while.