Fig. 6.
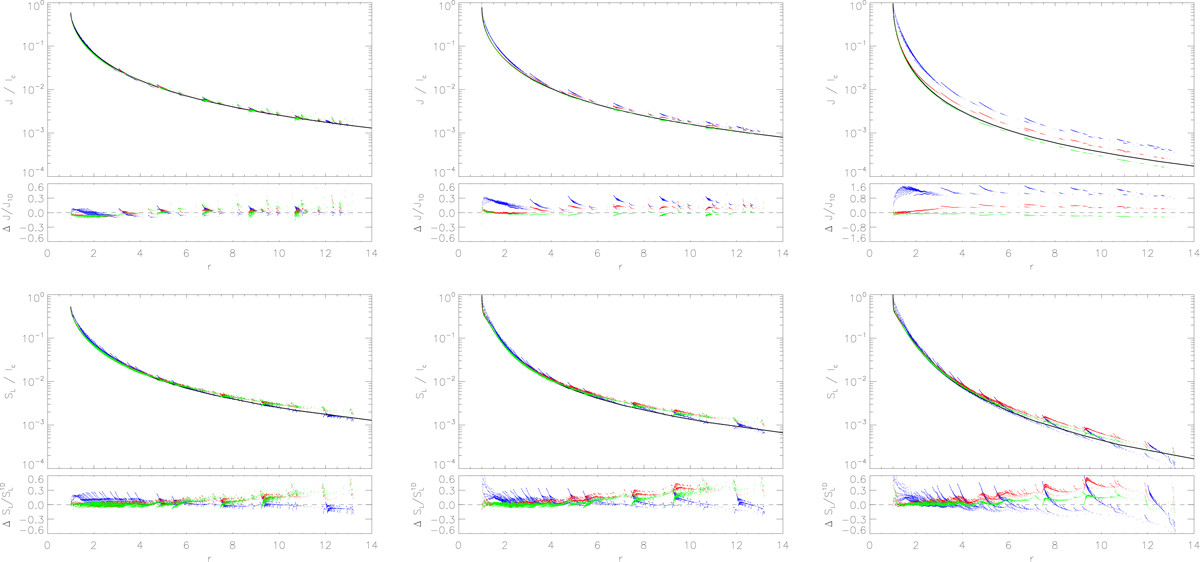
Solutions for the standard spherically symmetric models as calculated with the 3D FVM (blue) and 3D SC methods using linear (red) or Bézier (green) interpolations, compared to an accurate 1D solution (black solid line). The dots represent the solutions at specific grid points (with different latitudes and longitudes), where only a subset of all grid points is displayed to compress the image. Corresponding errors are indicated at the bottom of each chart. Top panel: mean intensity for the continuum transfer as a function of radius, with ϵC = 10−6, and kC = [1, 10, 100] from left to right. Bottom panel: line source function with ϵL = 10−6, and kL = [100, 103, 105] from left to right.
Current usage metrics show cumulative count of Article Views (full-text article views including HTML views, PDF and ePub downloads, according to the available data) and Abstracts Views on Vision4Press platform.
Data correspond to usage on the plateform after 2015. The current usage metrics is available 48-96 hours after online publication and is updated daily on week days.
Initial download of the metrics may take a while.