Fig. 3.
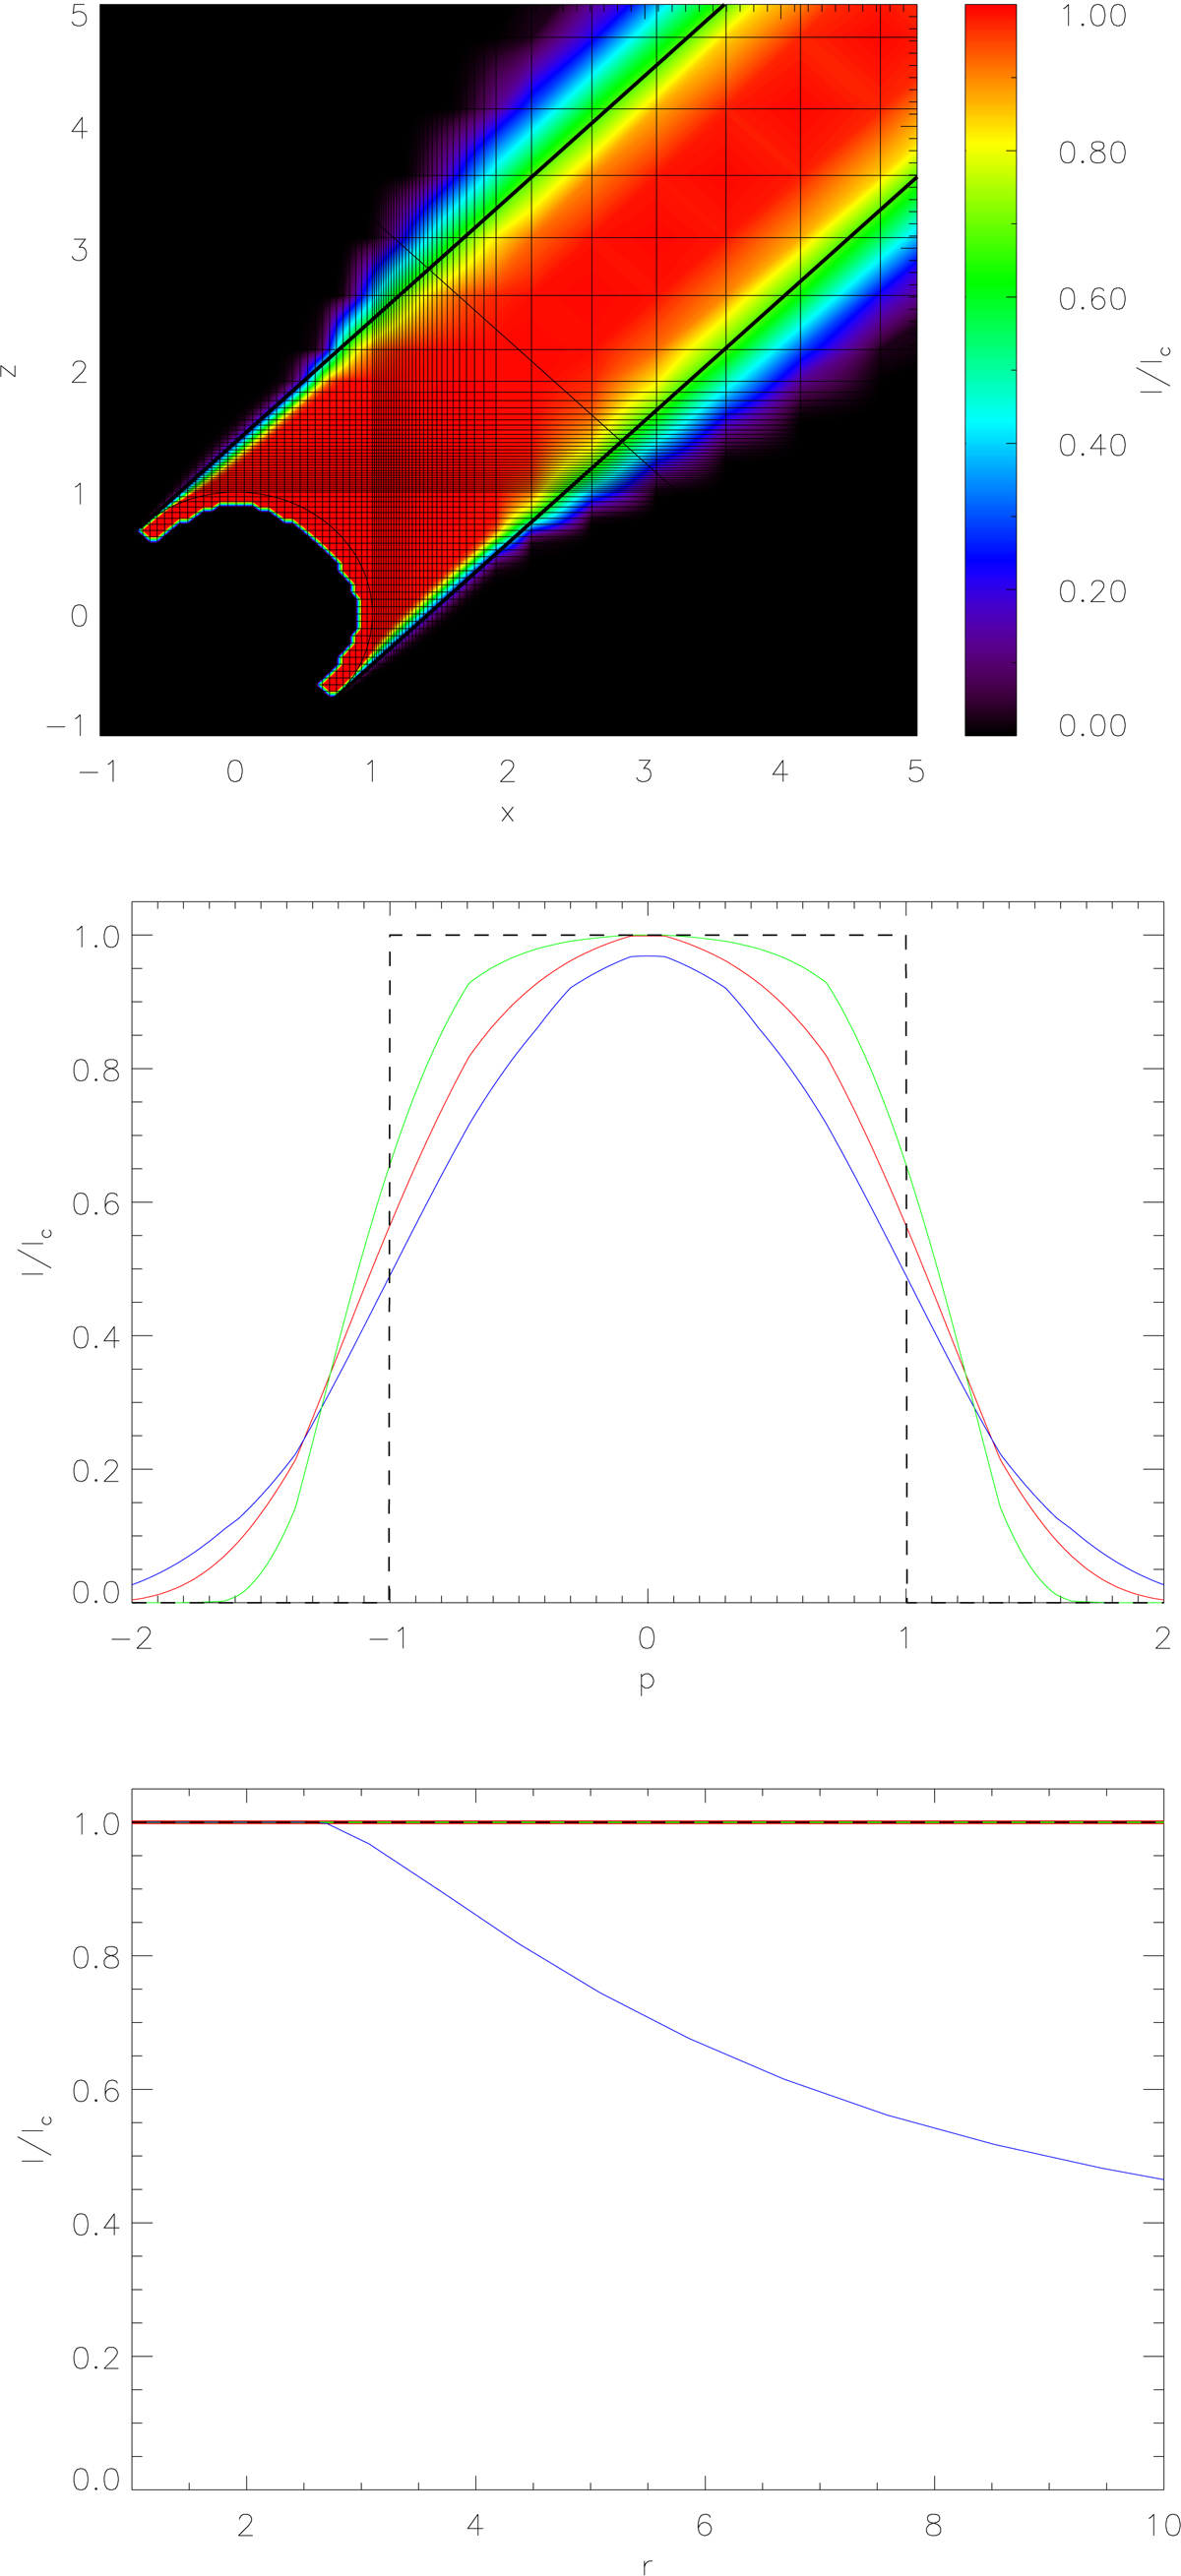
Searchlight-beam test for direction n = (1, 0, 1) and a typical grid with Nx = Ny = Nz = 133 grid points. Upper panel: contour plot of the specific intensity as calculated with the SC method using Bézier interpolations in the xz-plane (cf. Paper I, Fig. 3, for the finite-volume method). Middle panel: specific intensity through the perpendicular area indicated by the straight line in the upper panel. The blue, red, and green profiles correspond to the FVM, SClin, and SCbez methods, respectively. The dashed line indicates the theoretical profile. Bottom panel: as middle panel, but along the centre of the searchlight beam. We note that the SC methods reproduce the exact solution at the centre of the beam, whereas the FVM solution decreases significantly for r ≳ 2.5 R*.
Current usage metrics show cumulative count of Article Views (full-text article views including HTML views, PDF and ePub downloads, according to the available data) and Abstracts Views on Vision4Press platform.
Data correspond to usage on the plateform after 2015. The current usage metrics is available 48-96 hours after online publication and is updated daily on week days.
Initial download of the metrics may take a while.