Fig. B.2.
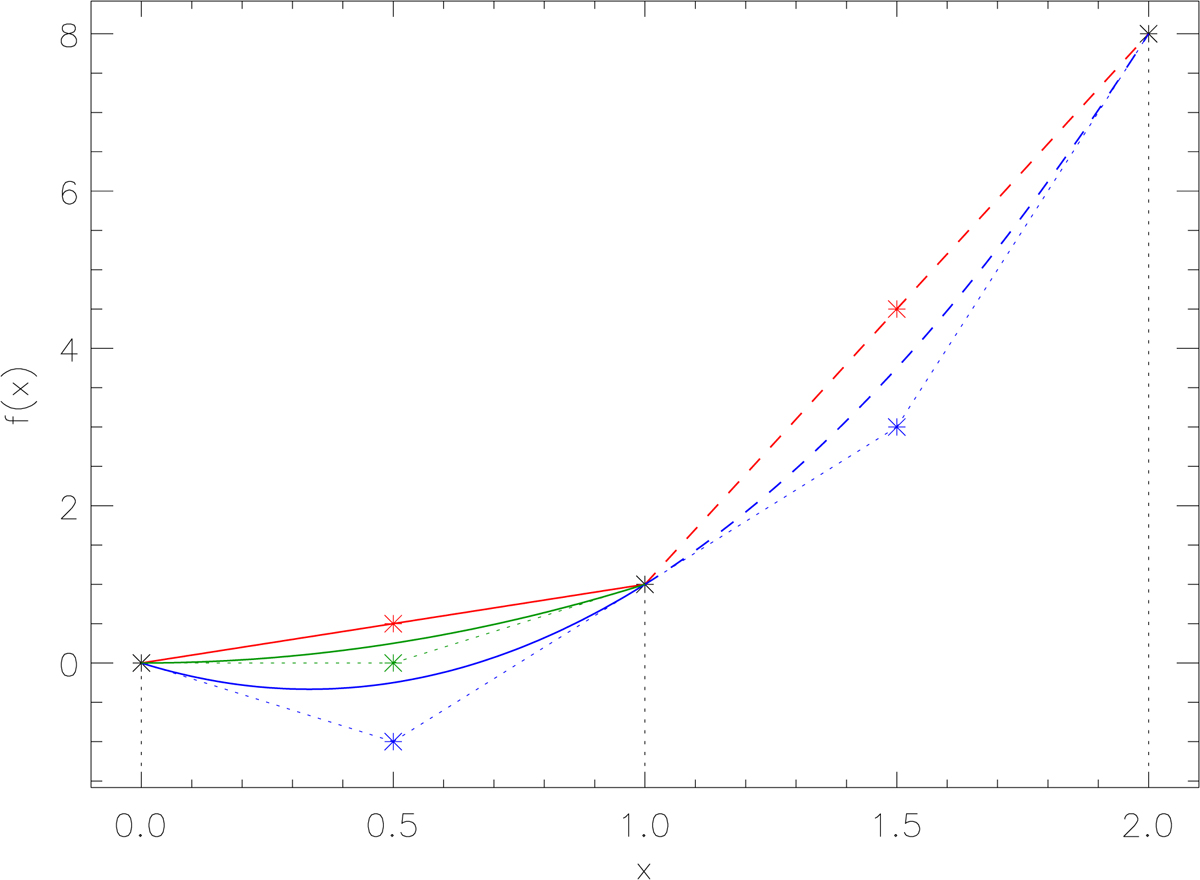
Different interpolation techniques for a set of three data points at x-coordinates indicated by the dotted vertical lines. The solid and dashed lines correspond to the interpolation in the different intervals [xi − 1, xi] and [xi, xi + 1], respectively. Linear interpolations, quadratic interpolations (connecting all three data points), and a monotonic Bézier curve (with ω calculated from Eq. (B.5) in the interval [xi − 1, xi]) are indicated in red, blue, and green. Since the quadratic interpolation is already monotonic in the interval [xi, xi + 1], the monotonic Bézier curve coincides with the dashed, blue line. Control points are indicated with coloured asterisks.
Current usage metrics show cumulative count of Article Views (full-text article views including HTML views, PDF and ePub downloads, according to the available data) and Abstracts Views on Vision4Press platform.
Data correspond to usage on the plateform after 2015. The current usage metrics is available 48-96 hours after online publication and is updated daily on week days.
Initial download of the metrics may take a while.