Free Access
Fig. B.1.
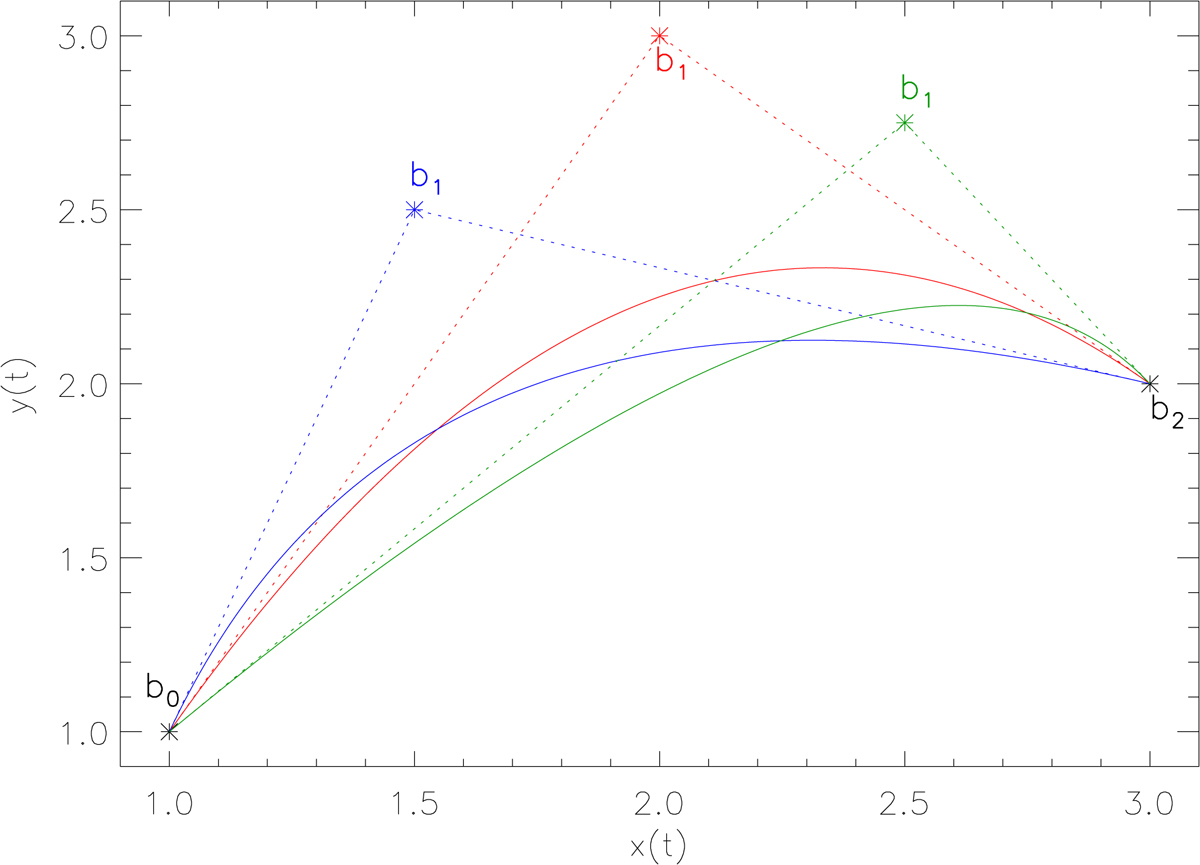
Bézier curves (solid lines) for three given points b0, b1, b2. The blue, red, and green lines represent the resulting curves for different control points b1. The straight connections of the control points with the data points are indicated by the dotted lines.
Current usage metrics show cumulative count of Article Views (full-text article views including HTML views, PDF and ePub downloads, according to the available data) and Abstracts Views on Vision4Press platform.
Data correspond to usage on the plateform after 2015. The current usage metrics is available 48-96 hours after online publication and is updated daily on week days.
Initial download of the metrics may take a while.