Fig. 7
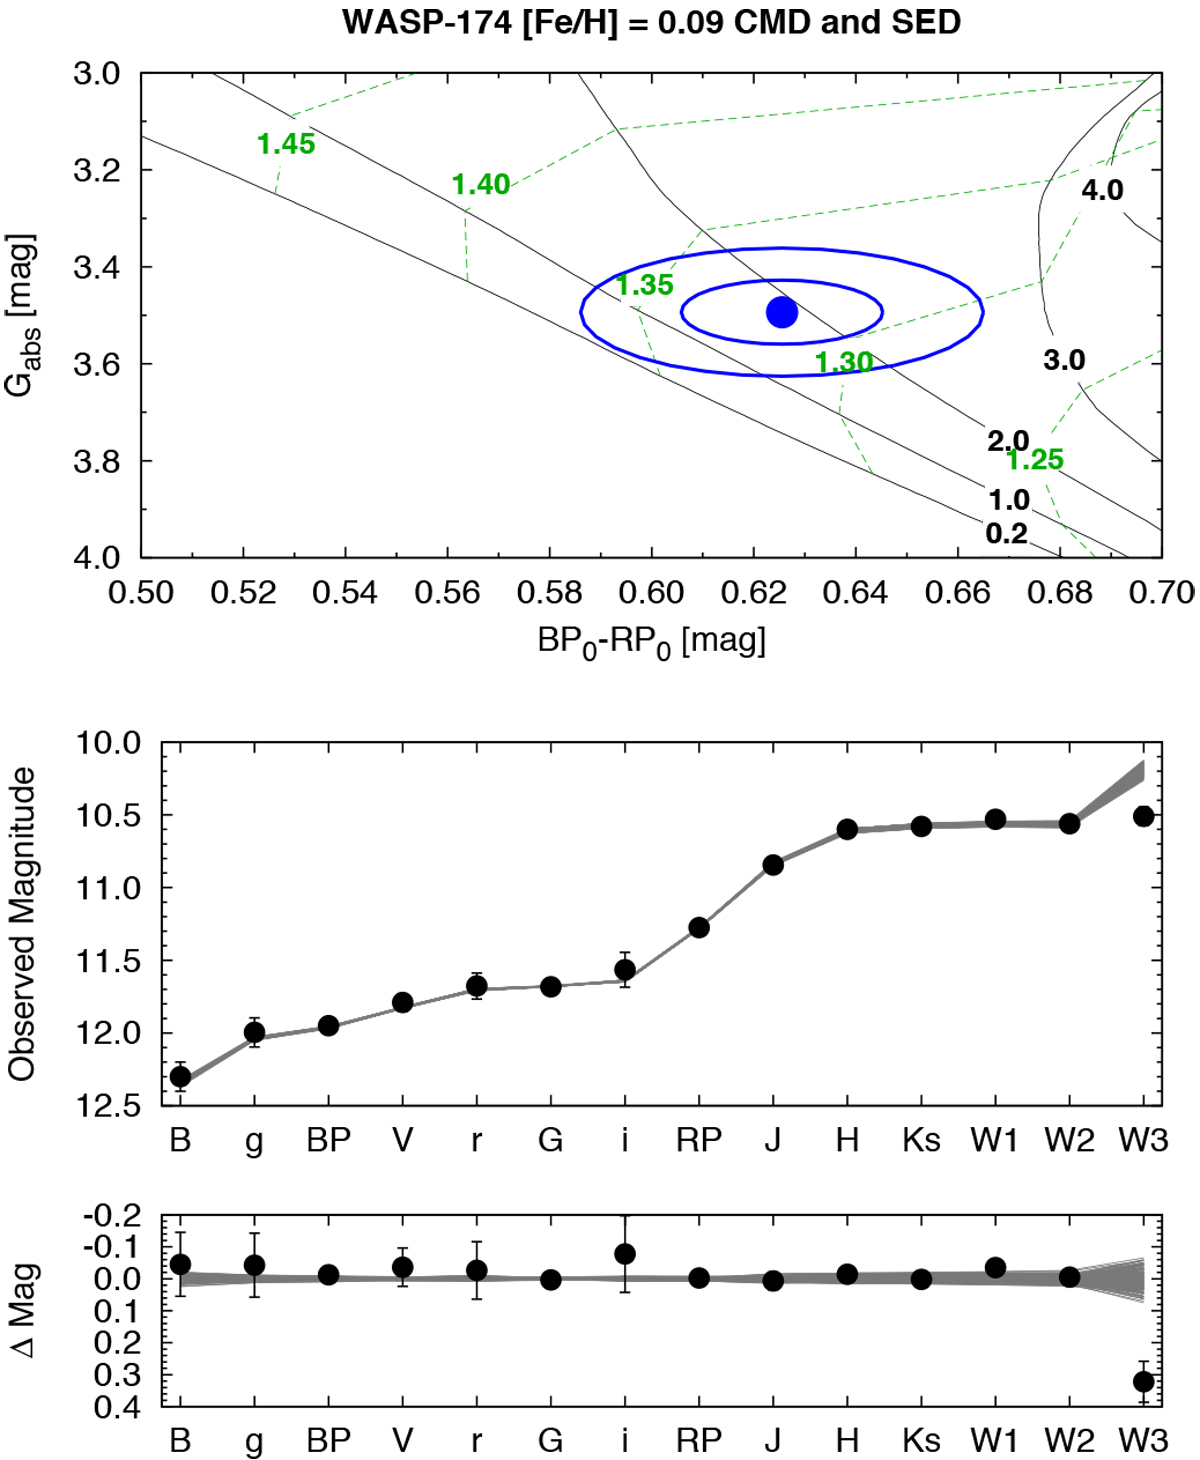
Top panel: color-magnitude diagram of WASP-174 compared to theoretical isochrones (black lines) and stellar evolution tracks (green lines) from the PARSEC models interpolated at its metallicity, which was spectroscopically determined. The stellar mass of each evolution track is reported in green in solar mass units, while the black numbers denote the age of of each isochrone in Gyr. The blue circle shows the measured reddening- and distance-corrected value from Gaia DR2, together with 1σ and 2σ confidence regions (blue lines). Bottom panels: broadband spectral energy distribution (black points) as photometrically measured through the observed filters, compared with model SEDs (gray lines), followed by the O–C residuals from the best-fit model.
Current usage metrics show cumulative count of Article Views (full-text article views including HTML views, PDF and ePub downloads, according to the available data) and Abstracts Views on Vision4Press platform.
Data correspond to usage on the plateform after 2015. The current usage metrics is available 48-96 hours after online publication and is updated daily on week days.
Initial download of the metrics may take a while.