Fig. 6
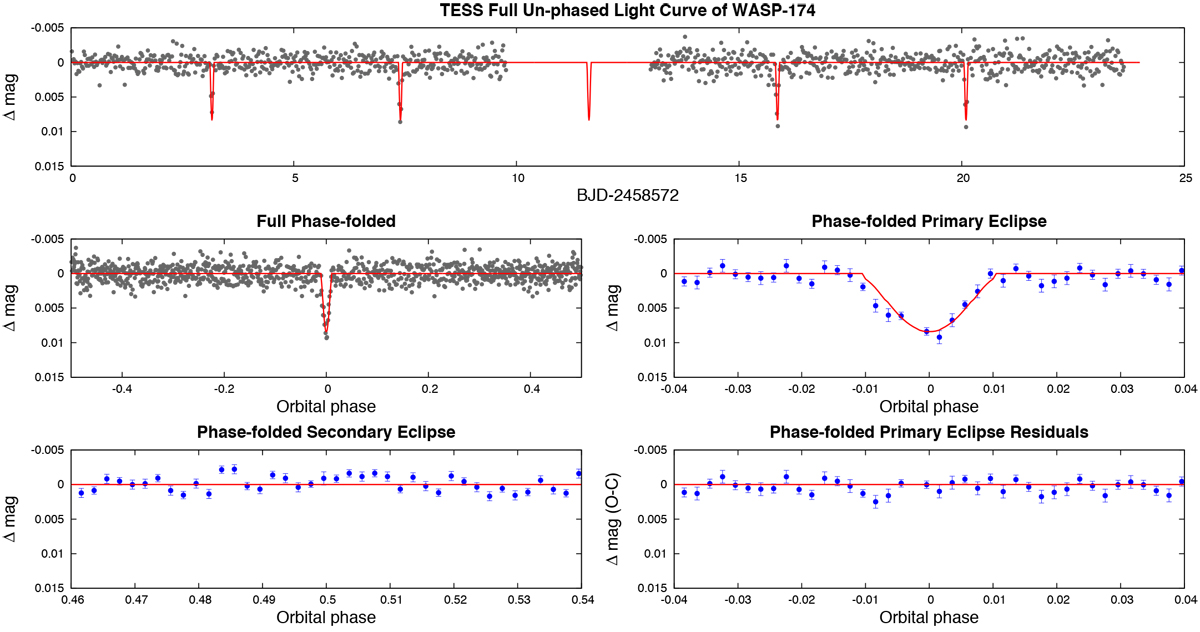
TESSlight curve of WASP-174 and our best fit from the global modeling (solid lines). The full un-phased light curve is plotted in the top panel. Left-hand middle panel: full phase-folded light curve, while left-hand bottom panel: phase-foldedlight curve zoomed-in on the secondary eclipse Right-hand middle panel: phase-folded light curve zoomed-in on the transit, while right-hand bottom panel: corresponding residuals from the best-fitting model.
Current usage metrics show cumulative count of Article Views (full-text article views including HTML views, PDF and ePub downloads, according to the available data) and Abstracts Views on Vision4Press platform.
Data correspond to usage on the plateform after 2015. The current usage metrics is available 48-96 hours after online publication and is updated daily on week days.
Initial download of the metrics may take a while.