Fig. 4
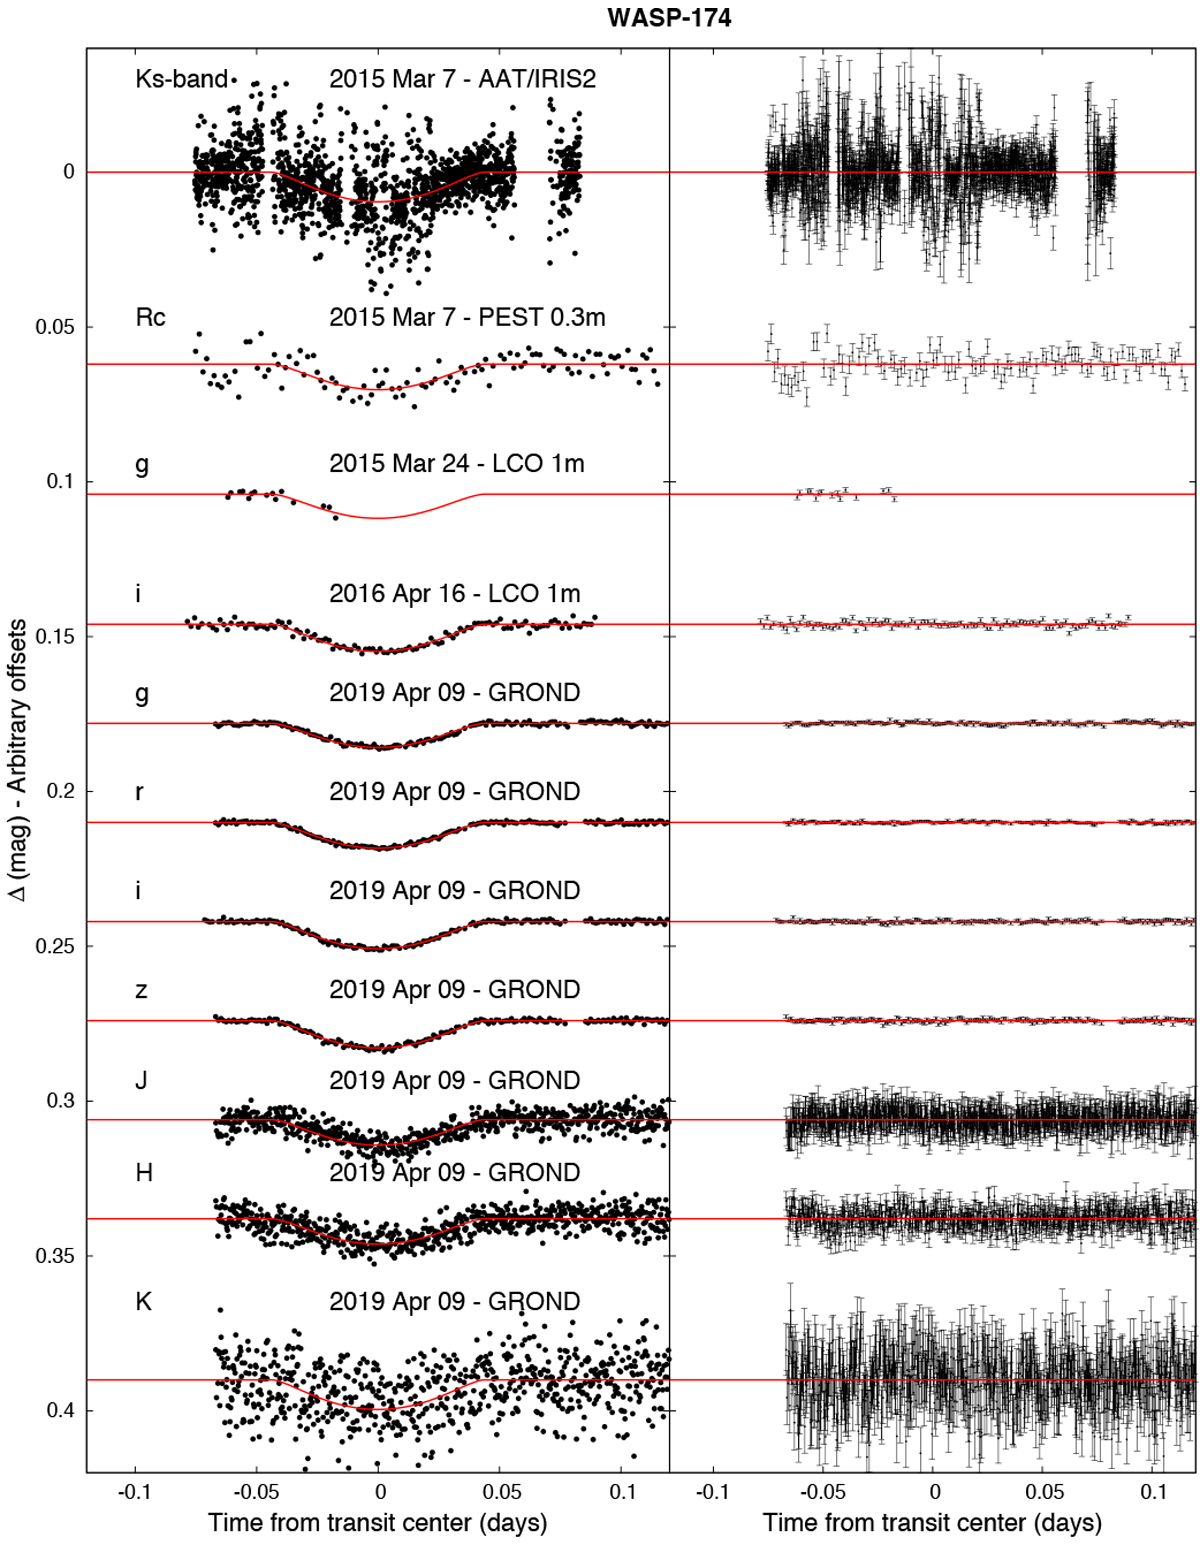
Unbinned transit light curves for WASP-174. The dates of the events, filters and instruments used are indicated. Light curves following the first are displaced vertically for clarity. Our best fit from the global modeling is shown by the solid lines. The residuals from the best-fitting model are shown on the right-hand-side in the same order as the original light curves. Note the precision of the GROND light curves, which have point-to-point scatters between 0.37 and 0.52 mmag.
Current usage metrics show cumulative count of Article Views (full-text article views including HTML views, PDF and ePub downloads, according to the available data) and Abstracts Views on Vision4Press platform.
Data correspond to usage on the plateform after 2015. The current usage metrics is available 48-96 hours after online publication and is updated daily on week days.
Initial download of the metrics may take a while.