Fig. 2
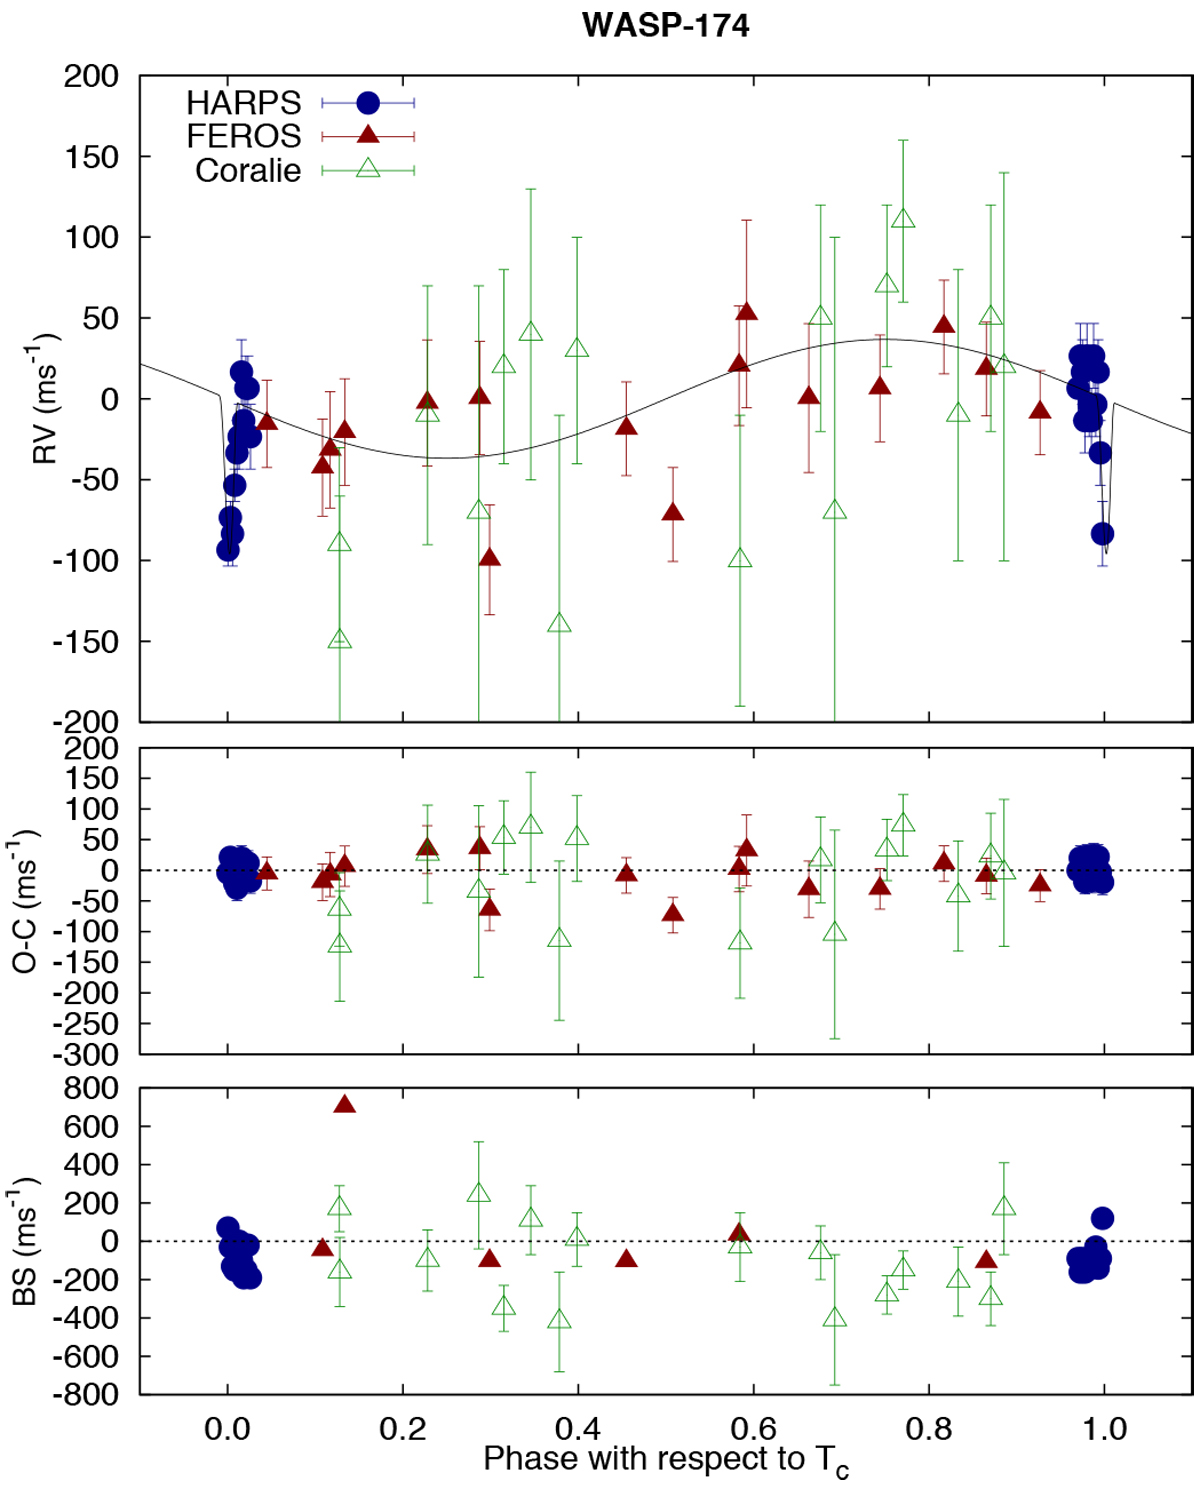
Phased high-precision RV measurements for WASP-174. The instruments used are labelled in the plots. Top panel: phased measurements together with our best-fit model. Zero-phase corresponds to the time of mid-transit. The center-of-mass velocity has been subtracted. The solid line shows the best-fitting model (see discussion in Sect. 3). Second panel: velocity O-C residuals from the best fit. Third panel: bisector spans (BS). Note the differentvertical scales of the panels.
Current usage metrics show cumulative count of Article Views (full-text article views including HTML views, PDF and ePub downloads, according to the available data) and Abstracts Views on Vision4Press platform.
Data correspond to usage on the plateform after 2015. The current usage metrics is available 48-96 hours after online publication and is updated daily on week days.
Initial download of the metrics may take a while.