Fig. 14
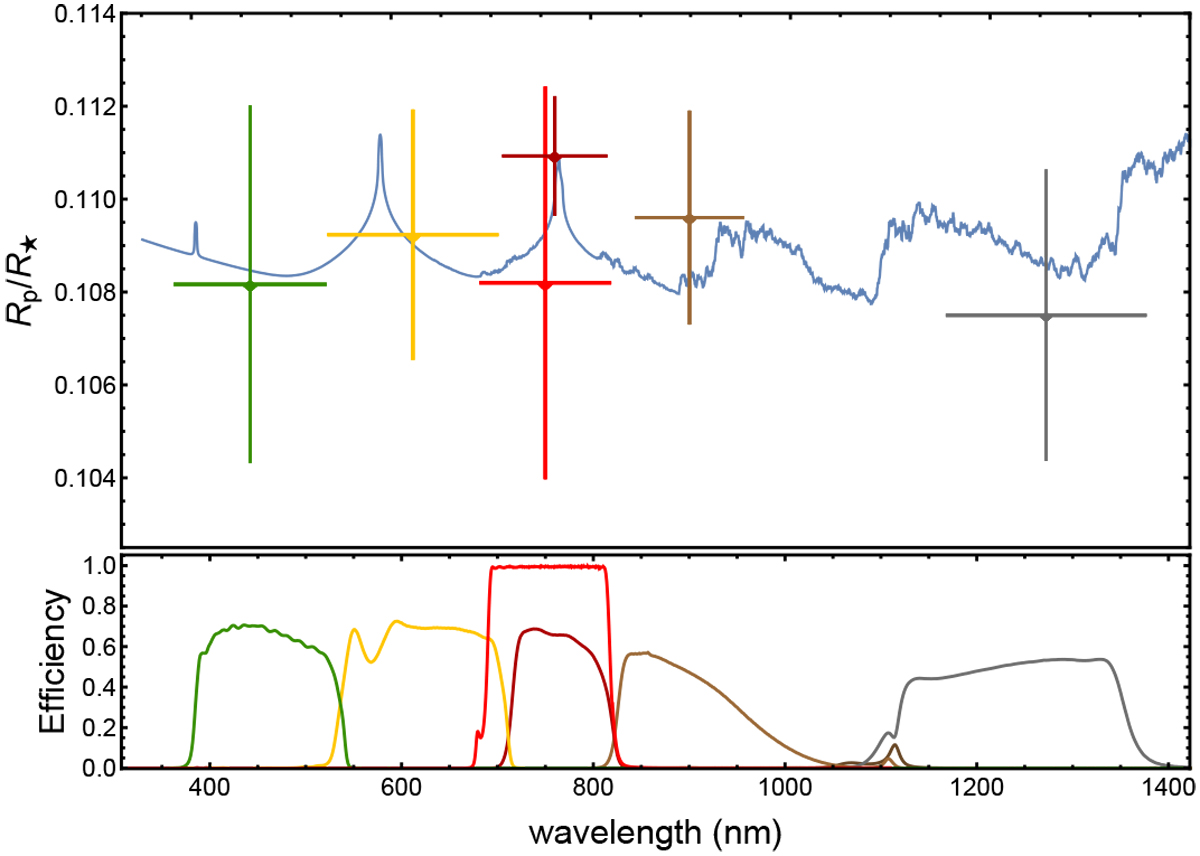
Variation of the planet/star radius ratio with wavelength. The colors are the same as in Fig. 4. The vertical bars represent the errors in the measurements and the horizontal bars show the FWHM transmission of the passbands used. The observational points are compared with an atmosphere model from Fortney et al. (2010). The transmission curve for the Sloan i filter and the total efficiencies of the GROND filters are shown in the bottom panel.
Current usage metrics show cumulative count of Article Views (full-text article views including HTML views, PDF and ePub downloads, according to the available data) and Abstracts Views on Vision4Press platform.
Data correspond to usage on the plateform after 2015. The current usage metrics is available 48-96 hours after online publication and is updated daily on week days.
Initial download of the metrics may take a while.