Fig. 4.
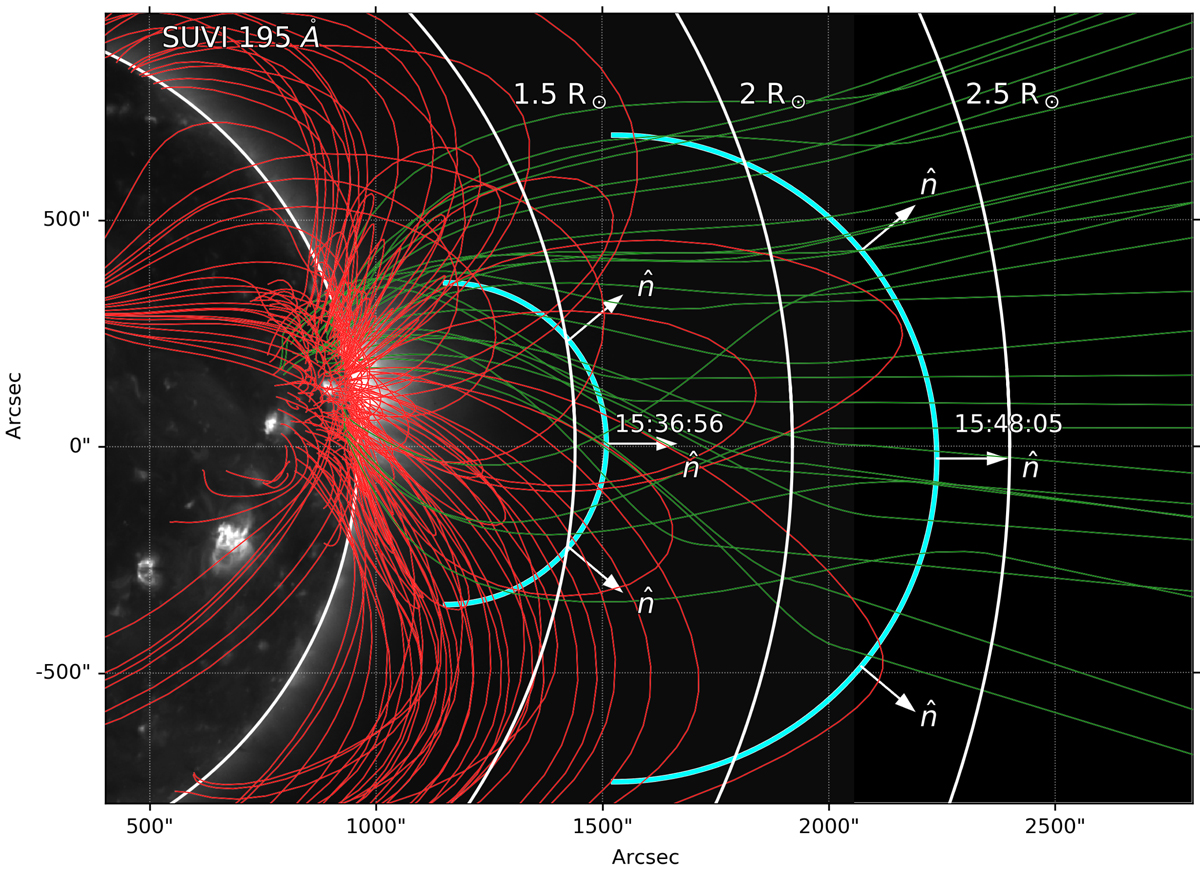
Potential magnetic field lines around the region of interest on 2017 September 2 overlaid on a GOES/SUVI image. A selection of closed (red) and open (green) field lines are shown. The cyan arcs represent the position of CME’s leading edge when the type II emission began at 15:36:56 UT and ceased 15:48:05 UT. The white arrows indicate the direction of the shock norm. The shock geometry is more likely to be quasi-perpendicular at the type II onset while a quasi-parallel configuration is more probable when radio emission ceases.
Current usage metrics show cumulative count of Article Views (full-text article views including HTML views, PDF and ePub downloads, according to the available data) and Abstracts Views on Vision4Press platform.
Data correspond to usage on the plateform after 2015. The current usage metrics is available 48-96 hours after online publication and is updated daily on week days.
Initial download of the metrics may take a while.