Fig. 3.
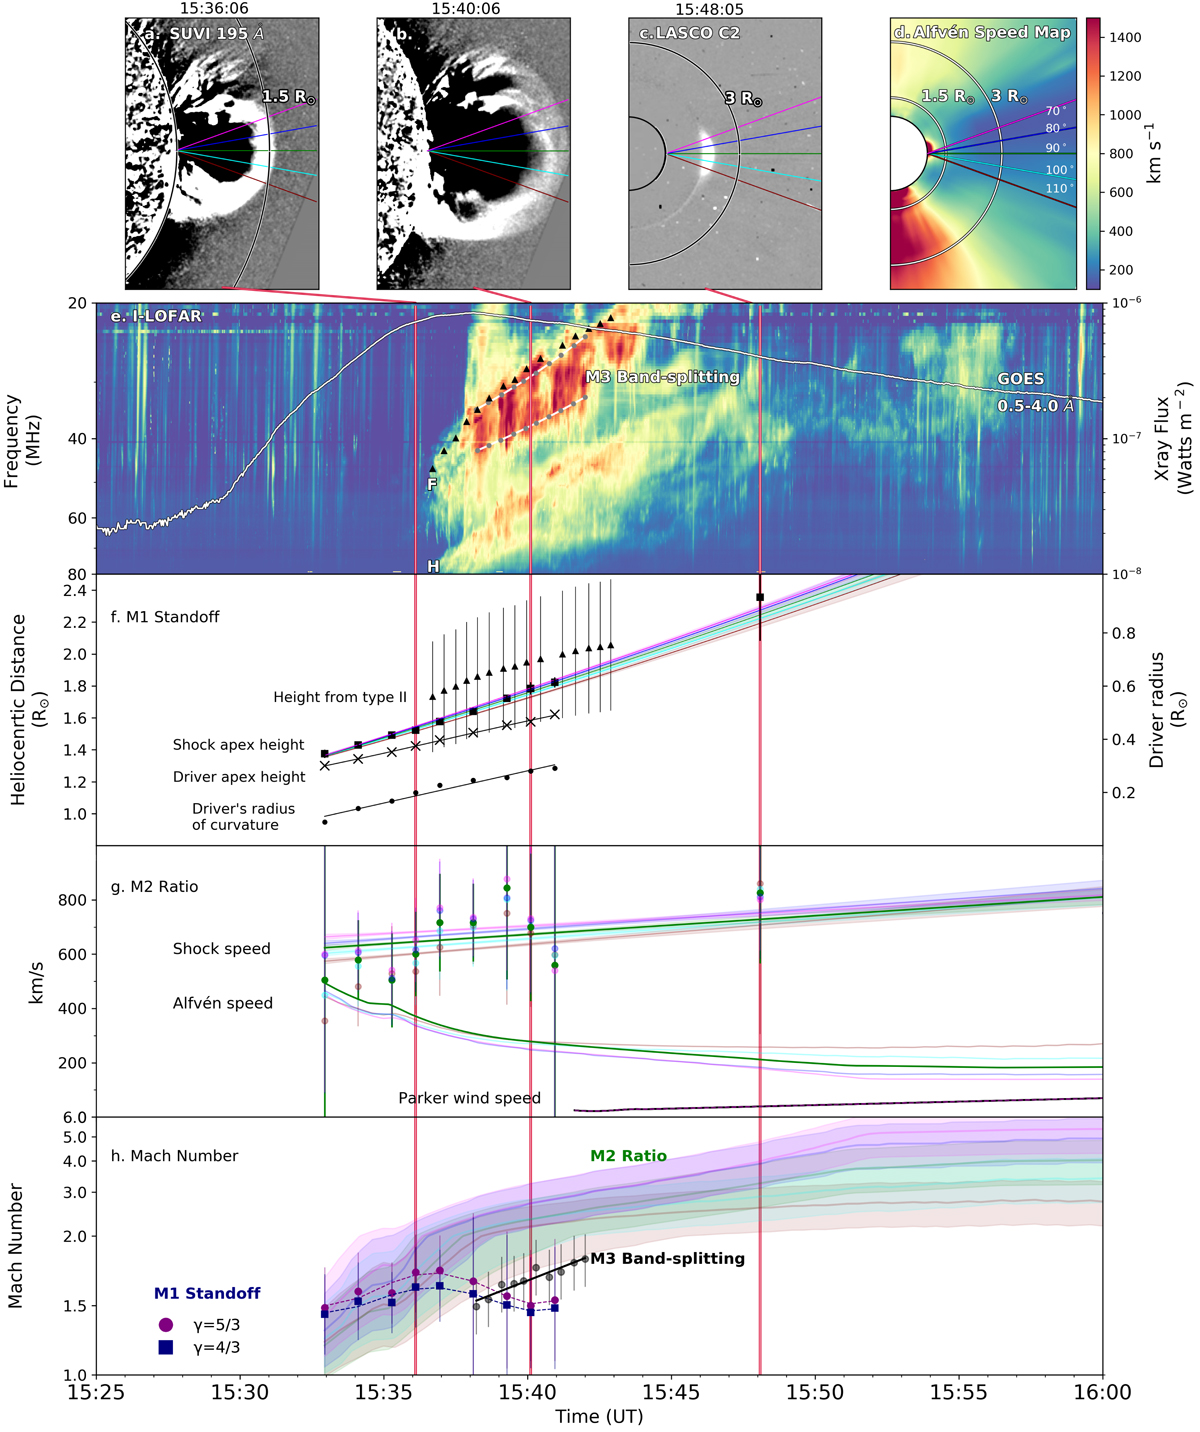
Panels a–c: base difference images from SUVI 195 Å and LASCO C2. Panel d: 2D Alfvén speed map produced from the model described in Zucca et al. (2014a). Overlaid are the color-coded traces used in the ratio method, starting at 70° to the solar north and separated by 10°. Panel e: type II radio burst dynamic spectra from I-LOFAR showing fundamental (F) and harmonic (H) components. The gray points indicate the upper and lower edges of the fundamental component. The black triangles on the fundamental mark the points used in the height of radio emission calculations. Overlaid is GOES high energy (0.5–4 Å) X-ray flux. Panel f: triangles indicate the source height of the type II fundamental derived from the 2D electron density map. The squares mark the shock front height along the green trace from SUVI and LASCO C2 measurements. The height-time profiles of the shock front from each trace, with the colors corresponding to the traces indicated in panels a–c. The CME driver height along the green trace is marked by crosses and the radius of curvature of the CME is marked by points. Panel g: estimated shock speed with uncertainties and Alfvén speed along the five traces marked in the images in the top panel. The black line plots the Parker solar wind solution from Mann et al. (2002). Panel h: MA evaluated using three methods: M1 (standoff distance), M2 (CME speed to Alfvén speed ratio) and M3 (band-splitting).
Current usage metrics show cumulative count of Article Views (full-text article views including HTML views, PDF and ePub downloads, according to the available data) and Abstracts Views on Vision4Press platform.
Data correspond to usage on the plateform after 2015. The current usage metrics is available 48-96 hours after online publication and is updated daily on week days.
Initial download of the metrics may take a while.