Fig. 2.
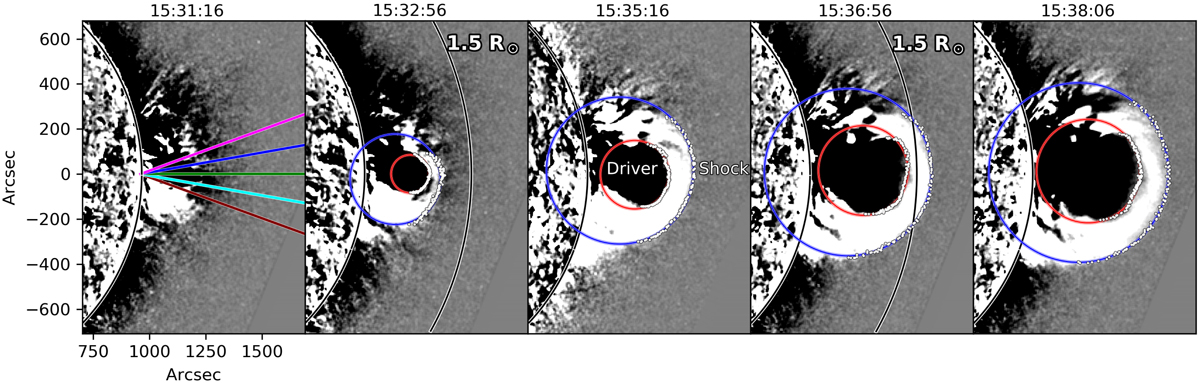
Base-difference images of the flaring region on the western limb of the Sun made by SUVI in the 195 Å channel from 15:31:16 to 15:38:06 UT, showing a dark region (interpreted as the driver) surrounded by an intensity enhancement (interpreted to be the shock sheath). The image contrast range was reduced to enhance these features. The SUVI base image is the average of 5 images prior to the start of the flare. The five traces examined in order to determine the CME apex are shown in the first image. The large red and blue circles indicate the fitting to the edges of the eruptive plasma and shock front respectively, with the circle width representing a ±1σ (±6″) uncertainty. The dots are the points along the driver and shock front chosen using a simple point-and-click method.
Current usage metrics show cumulative count of Article Views (full-text article views including HTML views, PDF and ePub downloads, according to the available data) and Abstracts Views on Vision4Press platform.
Data correspond to usage on the plateform after 2015. The current usage metrics is available 48-96 hours after online publication and is updated daily on week days.
Initial download of the metrics may take a while.