Fig. 3.
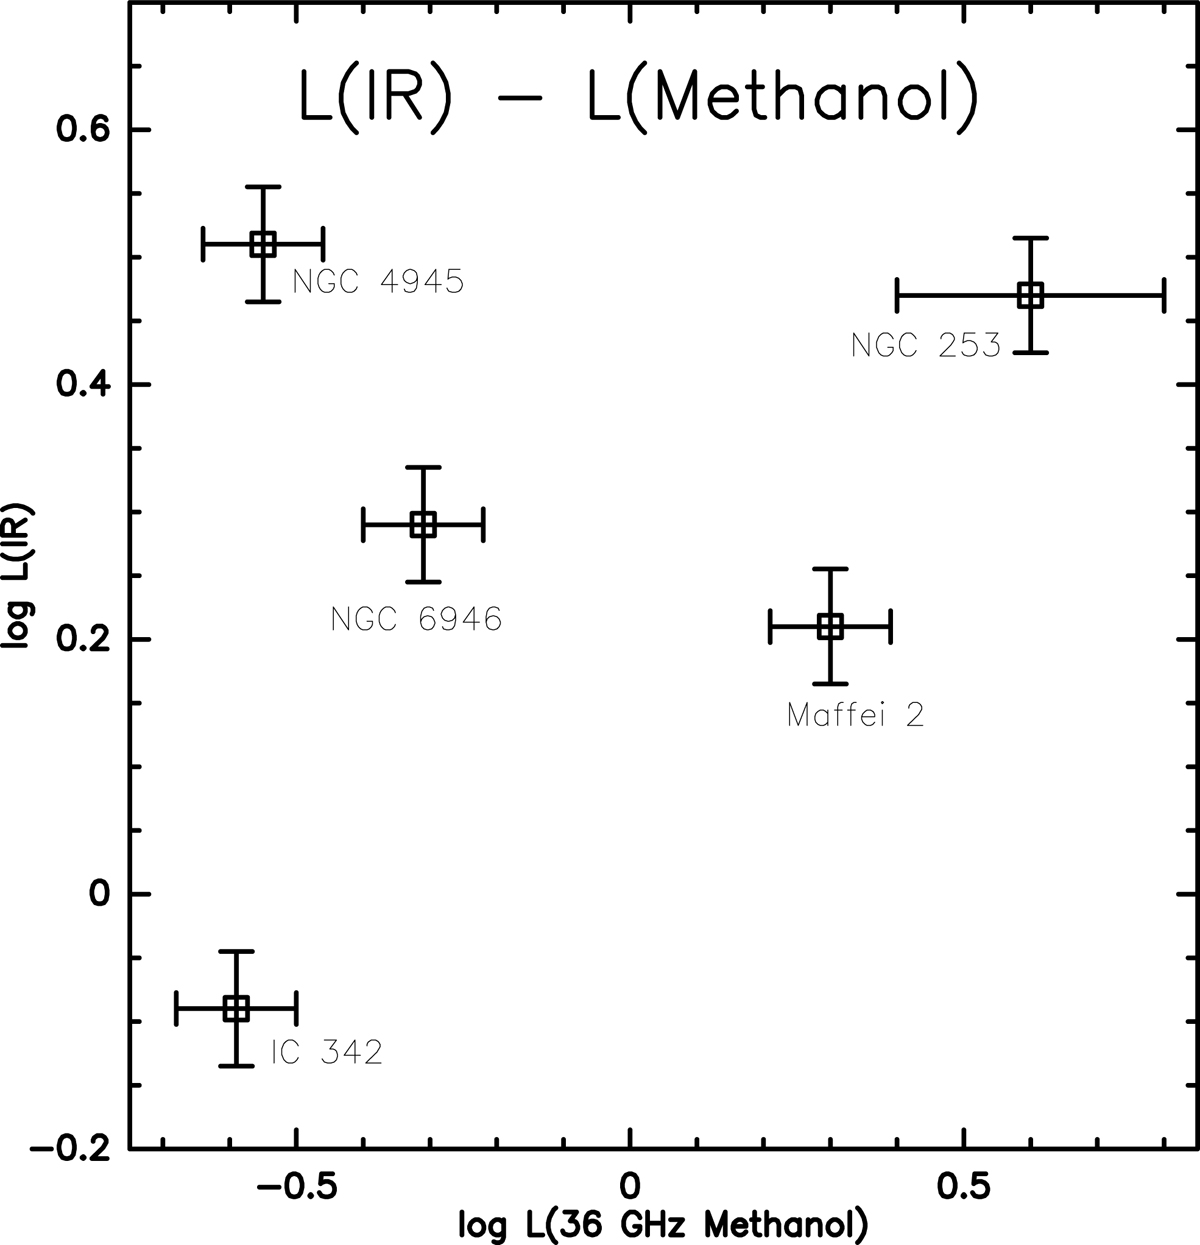
36 GHz methanol line luminosities in solar units vs. infrared luminosities in units of 1010 L⊙, obtained from IRAS data, on logarithmic scales. For the former, ±20% (see Sect. 2.2, we added 5% due to limited signal-to-noise ratios) and for the latter ±10% error bars have been taken. The exception is NGC 253, where a larger error bar has been chosen for the 36 GHz methanol luminosity (see below). Adopted distances to the galaxies are 3.28 Mpc for IC 342 (Sect. 4), 5.73 Mpc for Maffei 2 (Sect. 4), 5.98 Mpc for NGC 6946 (Gorski et al. 2018), 3.5 Mpc for NGC 253 (Gorski et al. 2018) and 3.8 Mpc for NGC 4945 (Henkel et al. 2018b). The methanol line luminosities were calculated with Eq. (1). There exist huge discrepancies in total 36 GHz methanol flux density in the case of NGC 253, with Ellingsen et al. (2014) finding ≈0.3 L⊙, Ellingsen et al. (2017) reporting ≈3 L⊙ and Gorski et al. (2017) suggesting 6.4 L⊙. We chose 4 L⊙. For NGC 4945, McCarthy et al. (2017) report 0.14 L⊙, while McCarthy et al. (2018b) find 2.8 L⊙. We have taken the latter value, suspecting that the lower luminosity values are due to missing flux (e.g., Chen et al. 2018) and that variability might also play a role.
Current usage metrics show cumulative count of Article Views (full-text article views including HTML views, PDF and ePub downloads, according to the available data) and Abstracts Views on Vision4Press platform.
Data correspond to usage on the plateform after 2015. The current usage metrics is available 48-96 hours after online publication and is updated daily on week days.
Initial download of the metrics may take a while.