Fig. 4.
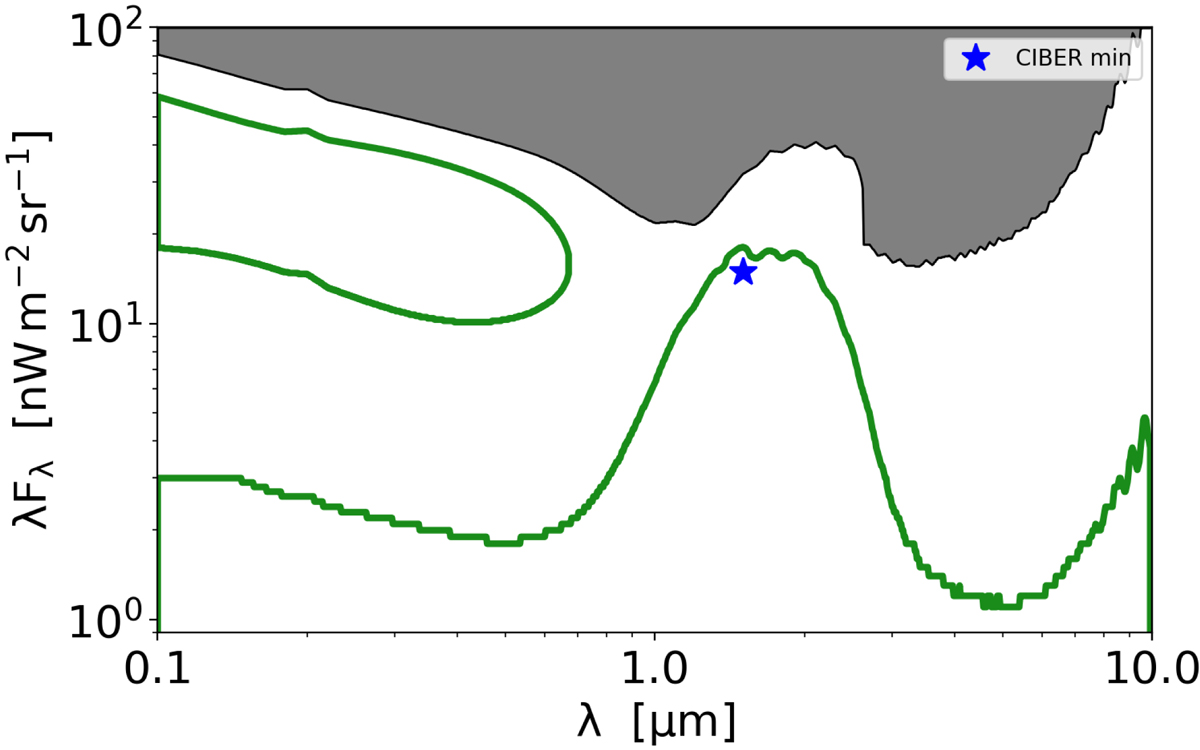
Cross section of three dimensional parameter space calculated for the bump width σ = 0.2 μm. The cross sections of 95% confidence level upper bound and the 68% confidence level contour around the best-fit value for the normalisation of the log-Gaussian EBL bump as a function of the central wavelength are shown with grey and green correspondingly. The data of 1ES 1218+304 are used. Blue star shows the measurement of the minimal EBL bump by CIBER (Matsuura 2017).
Current usage metrics show cumulative count of Article Views (full-text article views including HTML views, PDF and ePub downloads, according to the available data) and Abstracts Views on Vision4Press platform.
Data correspond to usage on the plateform after 2015. The current usage metrics is available 48-96 hours after online publication and is updated daily on week days.
Initial download of the metrics may take a while.