Fig. 2.
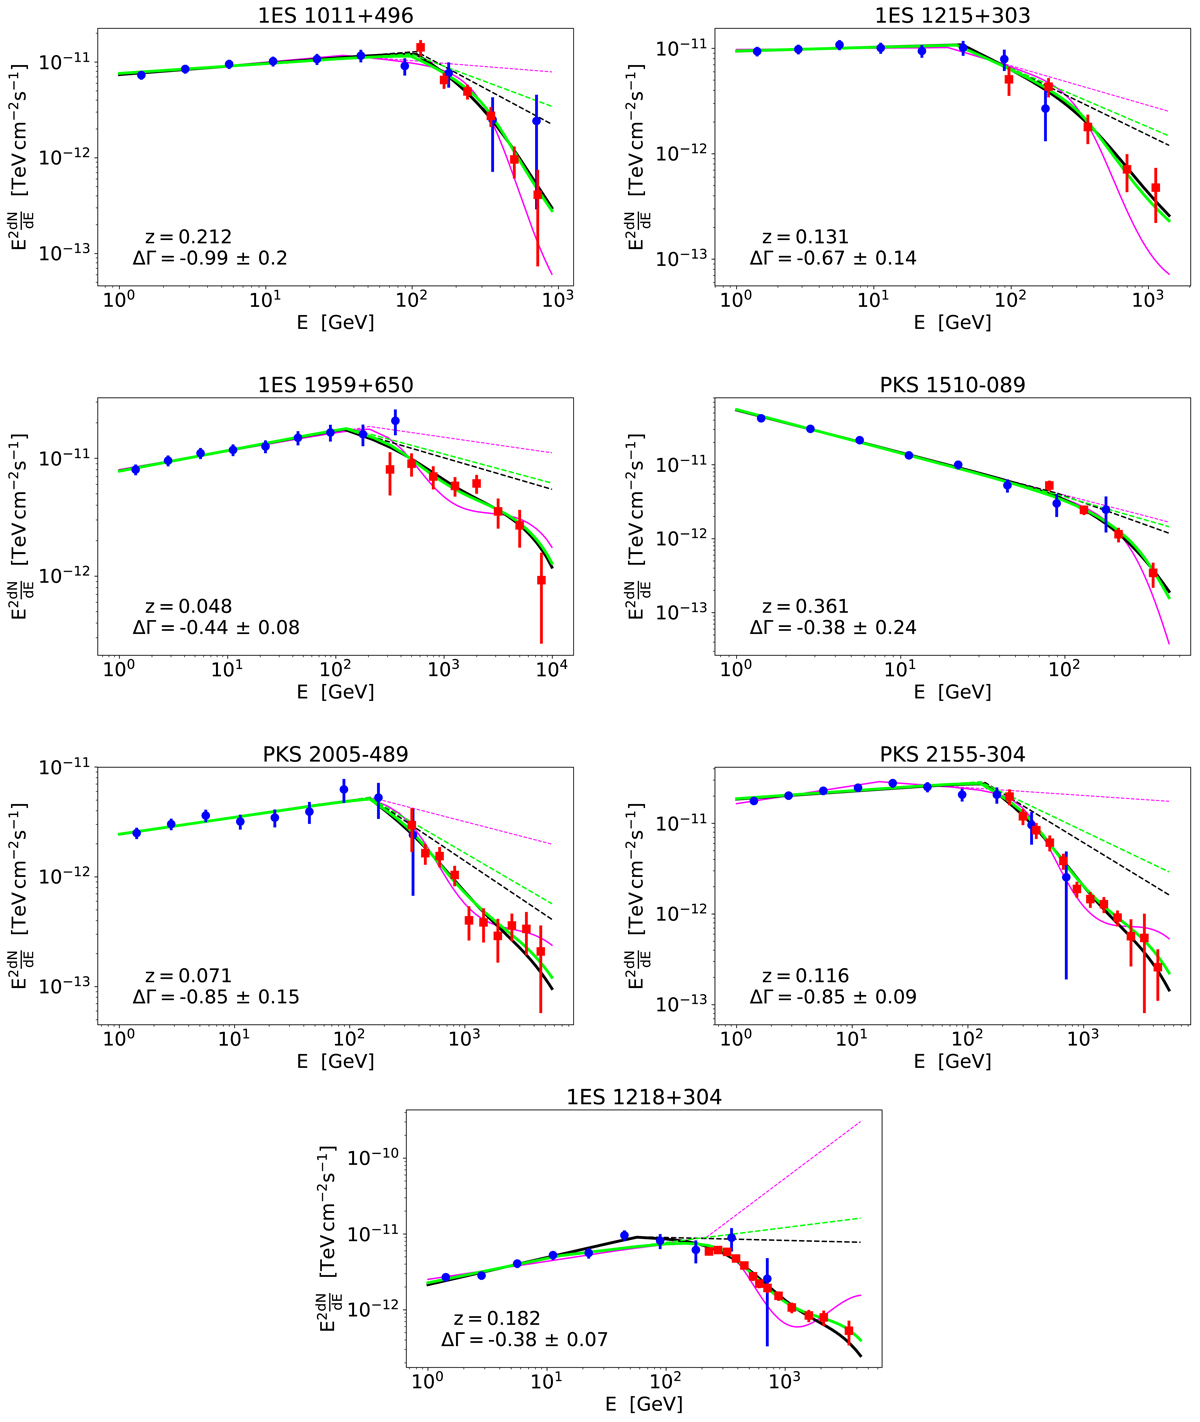
Broad band blazar’s spectra studied in this work. Blue circles and red squares correspond to Fermi/LAT and IACT parts of the spectra. Black dashed thin and black solid thick lines are the best-fit broken power law intrinsic spectra and observed spectra absorbed with the baseline EBL model. Dashed and solid green lines indicate the same thing, but for the baseline EBL with an additional narrow bump at the level of the minimal EBL excess measured by CIBER (Matsuura 2017). Dashed and solid magenta lines correspond to the baseline EBL with additional nominal EBL excess detected by CIBER (Matsuura 2017).
Current usage metrics show cumulative count of Article Views (full-text article views including HTML views, PDF and ePub downloads, according to the available data) and Abstracts Views on Vision4Press platform.
Data correspond to usage on the plateform after 2015. The current usage metrics is available 48-96 hours after online publication and is updated daily on week days.
Initial download of the metrics may take a while.