Fig. 1.
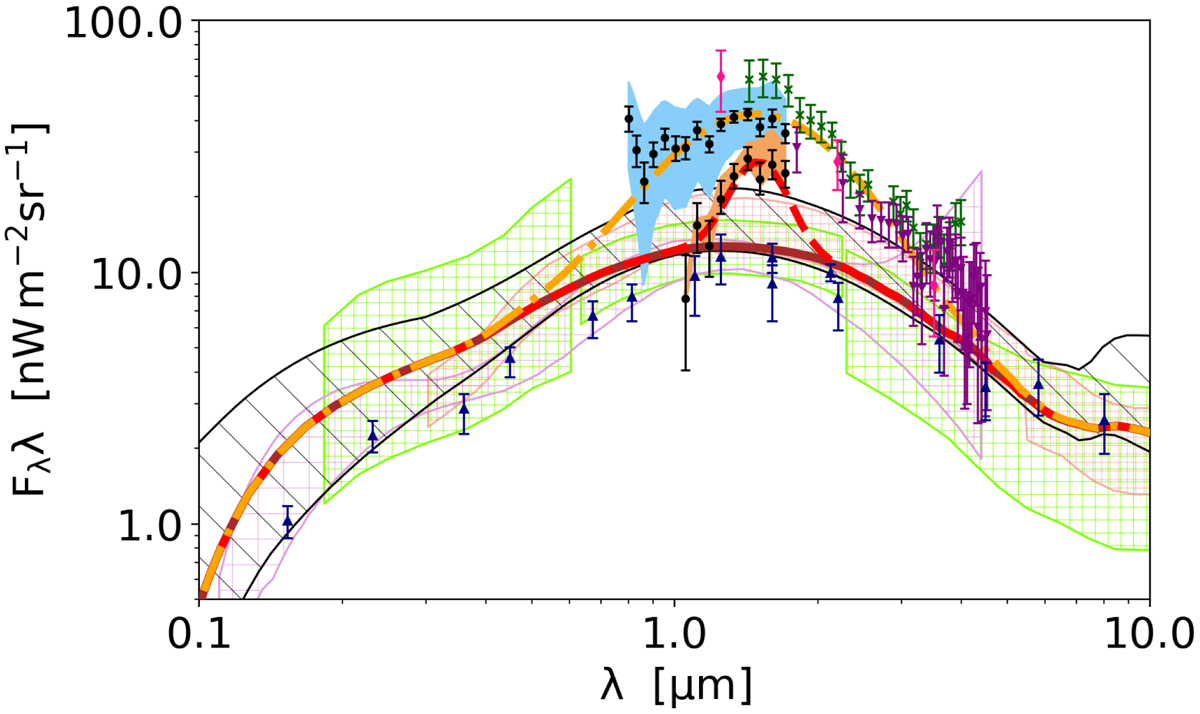
SED of the EBL obtained by various methods. Direct measurements: purple arrows are results from AKARI (Tsumura et al. 2013), while green asterisks are from the reanalysis of IRTS (Matsumoto et al. 2015). Pink diamonds are from the reanalysis of COBE/DIRBE measurements (Sano et al. 2015, 2016). Black data points together with blue and orange systematic uncertainty are derived from CIBER (Matsuura 2017) and correspond to nominal and minimum EBL models. Lower limits: dark blue upward arrows combine EBL lower limits obtained by different experiments: GALEX (Xu et al. 2005), Hubble Deep Field (Madau & Pozzetti 2000), Subaru (Keenan et al. 2010), and Spitzer/IRAC (Fazio 2004). EBL from γ-ray absorption: striped lime, red, and purple bands are from MAGIC (Acciari et al. 2019), HESS (Abramowski et al. 2013), and Fermi/LAT (Abdollahi et al. 2018), correspondingly. Modelling: dark red solid line is for baseline EBL model of Gilmore et al. (2012). Black striped band shows the allowed range of EBL models obtained with the global fit to EBL by Korochkin & Rubtsov (2018). Dash-dotted orange and dashed red lines are additional wide and narrow Gaussian components.
Current usage metrics show cumulative count of Article Views (full-text article views including HTML views, PDF and ePub downloads, according to the available data) and Abstracts Views on Vision4Press platform.
Data correspond to usage on the plateform after 2015. The current usage metrics is available 48-96 hours after online publication and is updated daily on week days.
Initial download of the metrics may take a while.