Fig. 2
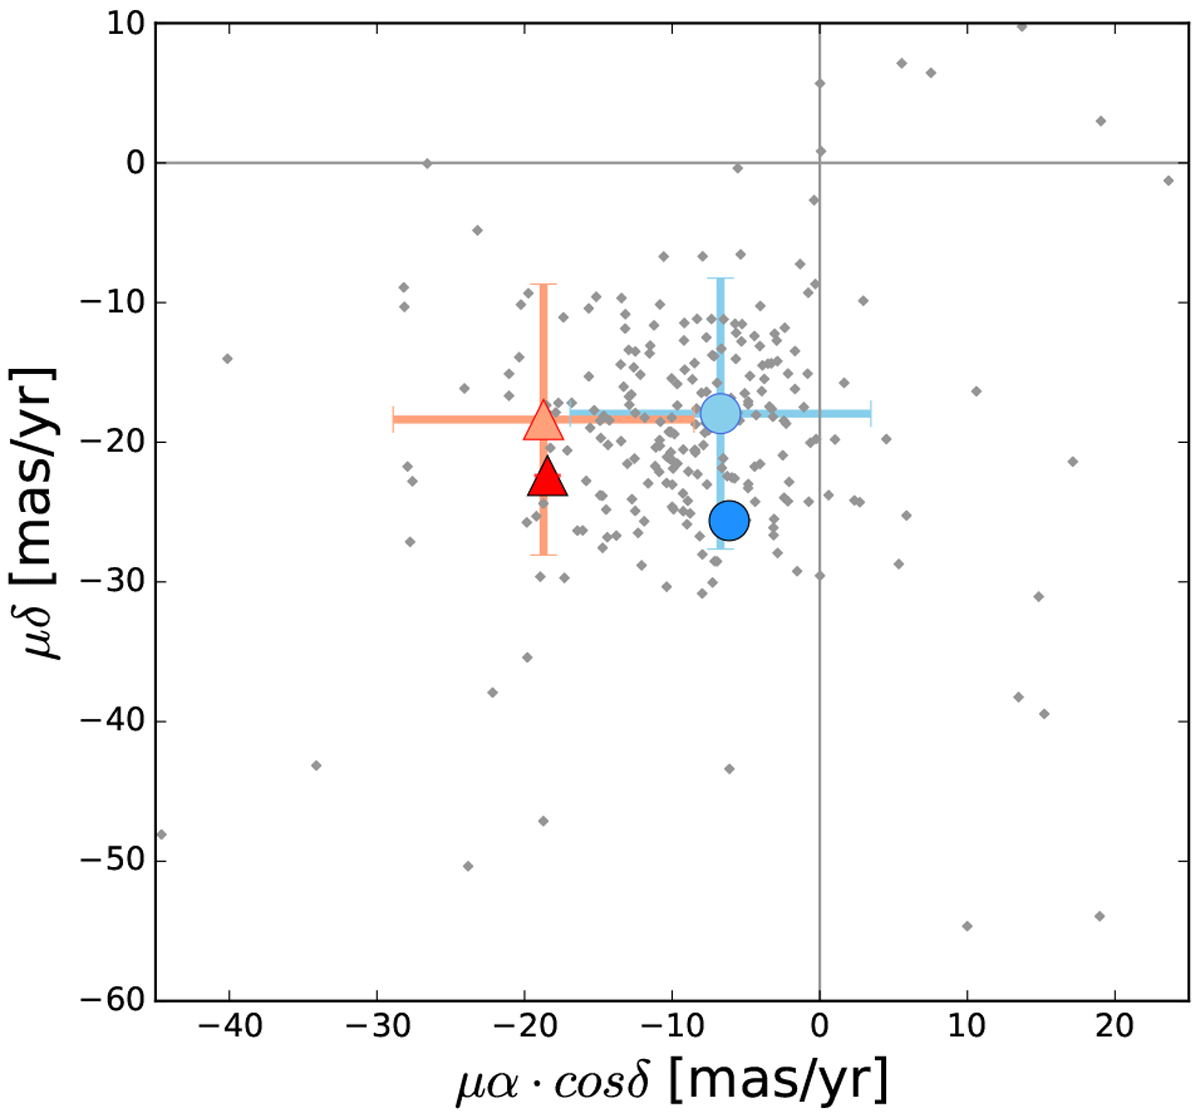
Proper motion diagram of USco1621 A and B (blue circles) and USco1556 A and B (red triangles). The proper motions of USco known members from our VHS vs. UKIDSS GCS cross-correlation are plotted with grey dots. The proper motions of the secondaries are calculated from the VHS and UKIDSS GCS astrometricdata and plotted in lighter colours, while the proper motions of the primaries are obtained from Gaia DR2 and plotted in darker colours. The error bars of the Gaia DR2 measurements are smaller than the size of the symbols.
Current usage metrics show cumulative count of Article Views (full-text article views including HTML views, PDF and ePub downloads, according to the available data) and Abstracts Views on Vision4Press platform.
Data correspond to usage on the plateform after 2015. The current usage metrics is available 48-96 hours after online publication and is updated daily on week days.
Initial download of the metrics may take a while.