Fig. 14
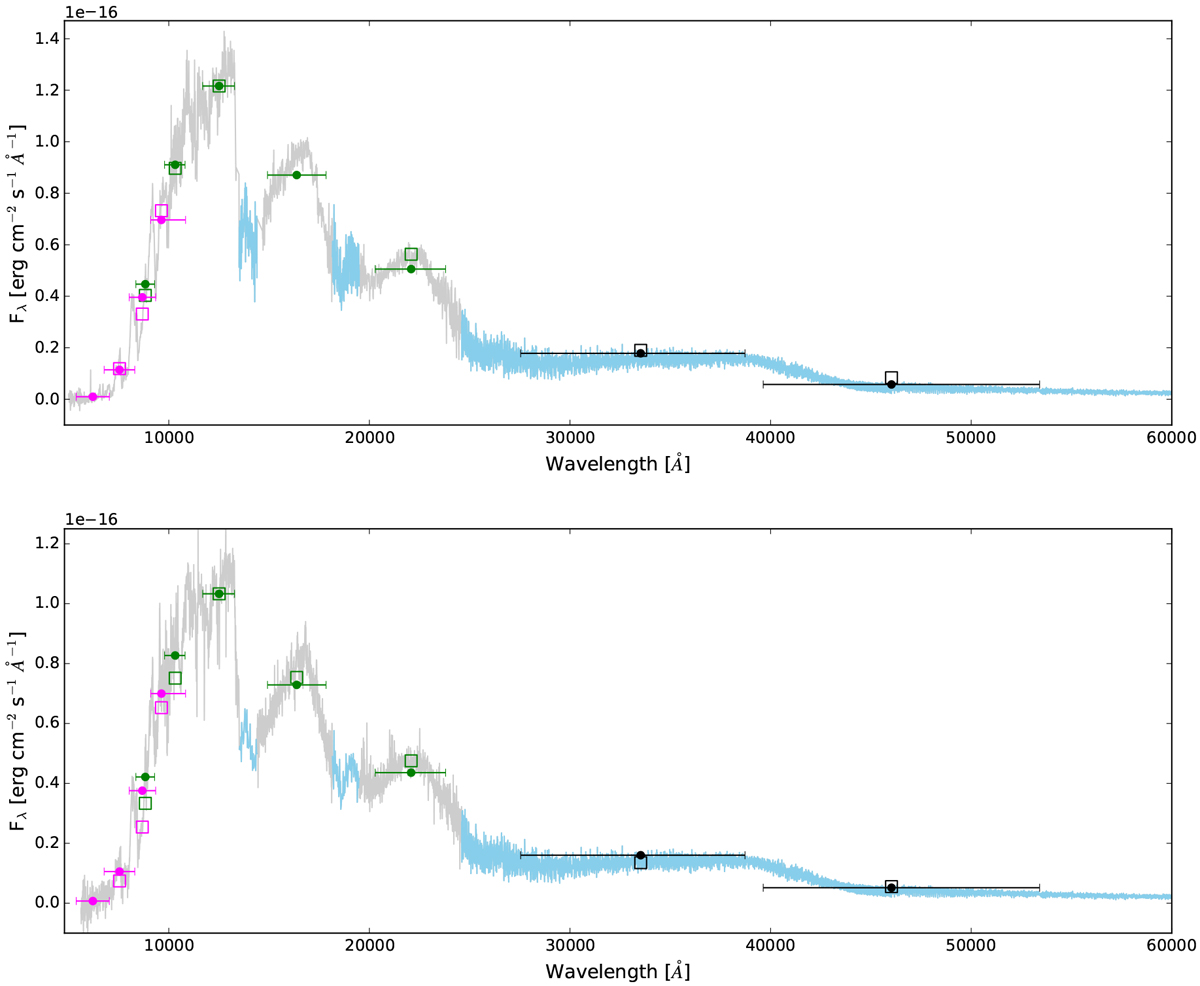
Optical + Infrared spectra of USco1621 B (upper panel) and USco1556 B (lower panel), in grey, completed with a Teff = 2000 K and log (g) = 4.0 BT-Settl model spectrum from Allard et al. (2012); Baraffe et al. (2015), in light blue. Available photometry from Pan-STARRS (pink open squares), UKIDSS (green open squares), and AllWISE (black open squares) is added. Vertical error bars of the photometry are smaller than the markers. Filled circles correspond to the flux values obtained through direct integration of the spectra in the same filter bands. Horizontal error bars represent the filter bandwidths.
Current usage metrics show cumulative count of Article Views (full-text article views including HTML views, PDF and ePub downloads, according to the available data) and Abstracts Views on Vision4Press platform.
Data correspond to usage on the plateform after 2015. The current usage metrics is available 48-96 hours after online publication and is updated daily on week days.
Initial download of the metrics may take a while.