Fig. 8
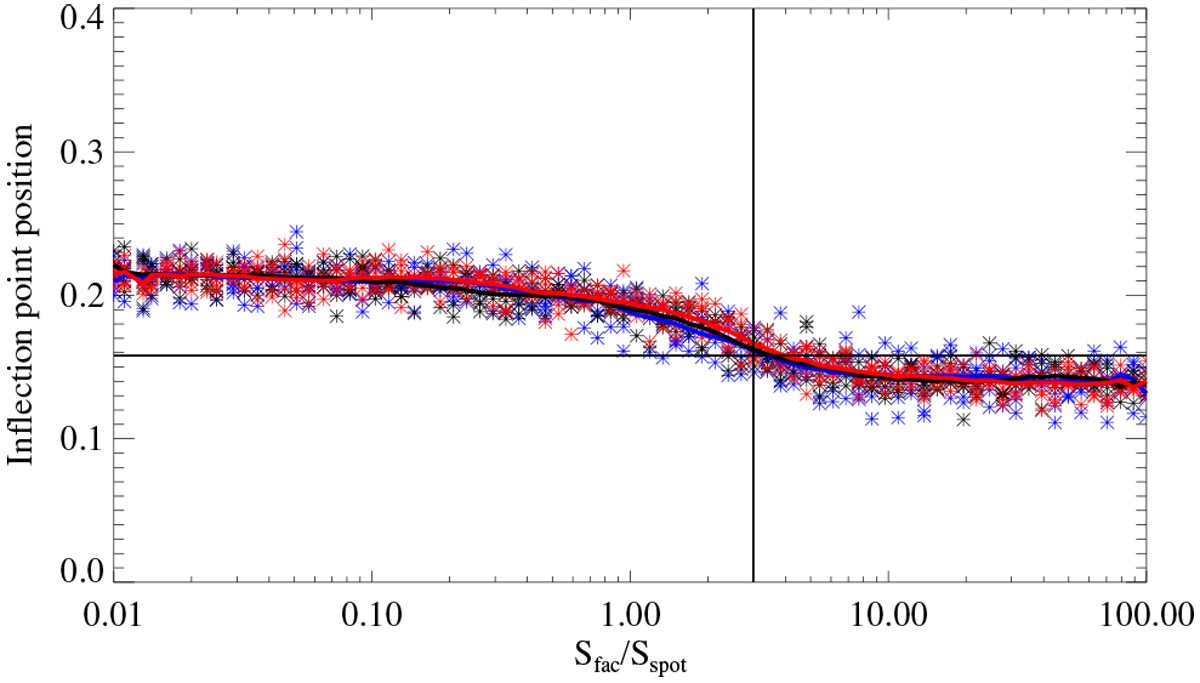
Dependence of inflection point position (given as fraction of rotation period, Prot = 30 d) on facularto spot area ratio at time of maximum area, Sfac∕Sspot. Shown in red are the calculations with lifetime of facular component of active regions, Tfac, equal to the lifetime of spot component, Tspot. Black and blue correspond to the Tfac∕Tspot = 2 and Tfac ∕Tspot = 3 cases, respectively. For each pair of Sfac∕Sspot and Tfac ∕Tspot values five realizations of emergences of active regions are shown. In other words, each of the Sfac ∕Sspot values correspond to five red, five black, and five blue asterisks. Red, black, and blue lines mark the positions of the inflection points averaged over the five corresponding realizations. The black horizontal line indicates the position of the solar inflection point from Amazo-Gomez et al. (2019), while the black vertical line marks the solar Sfac ∕Sspot value established in Appendix B.
Current usage metrics show cumulative count of Article Views (full-text article views including HTML views, PDF and ePub downloads, according to the available data) and Abstracts Views on Vision4Press platform.
Data correspond to usage on the plateform after 2015. The current usage metrics is available 48-96 hours after online publication and is updated daily on week days.
Initial download of the metrics may take a while.