Fig. 7
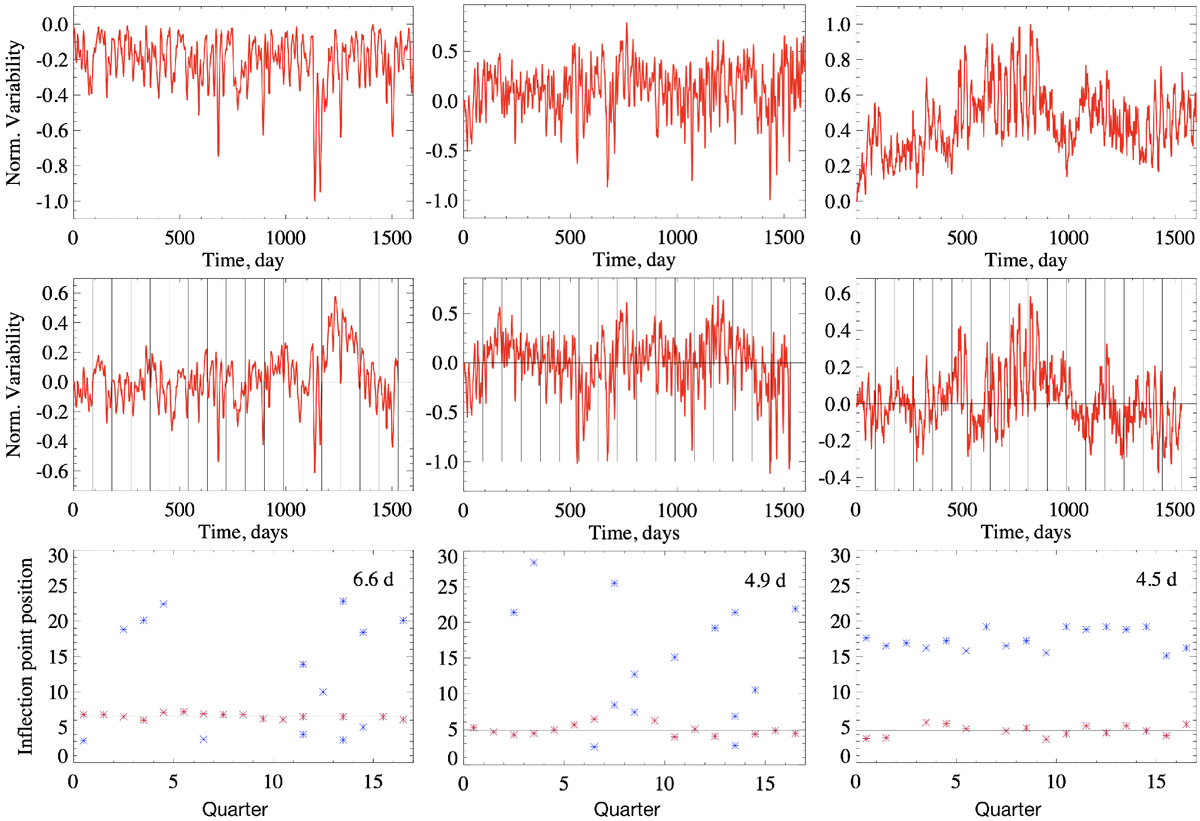
Three examples of simulated stellar variability: spot-dominated variability (Sfac ∕Sspot = 0.01, left panels), intermediate case (Sfac∕Sspot = 3, middle panels), and faculae-dominated variability (Sfac∕Sspot = 100, right panels). Upper panels: original (i.e., without any detrending) light curves. Intermediate panels show light curves split in 17 90-day quarters and linearly detrended in each of the quarters. The separation between quarters is marked by the vertical black lines. The asterisks in the lower panels correspond to the positions of inflection points in each of the quarters. Numbers in the upper right corners of the lower panels are the outlier-resistant mean values of the inflection point positions. These values are also indicated in the lower panels by horizontal black lines. Red asterisks correspond to the inflection points utilized for calculating the outlier-resistant mean value, blue asterisks are trimmed as outliers.
Current usage metrics show cumulative count of Article Views (full-text article views including HTML views, PDF and ePub downloads, according to the available data) and Abstracts Views on Vision4Press platform.
Data correspond to usage on the plateform after 2015. The current usage metrics is available 48-96 hours after online publication and is updated daily on week days.
Initial download of the metrics may take a while.