Fig. 6
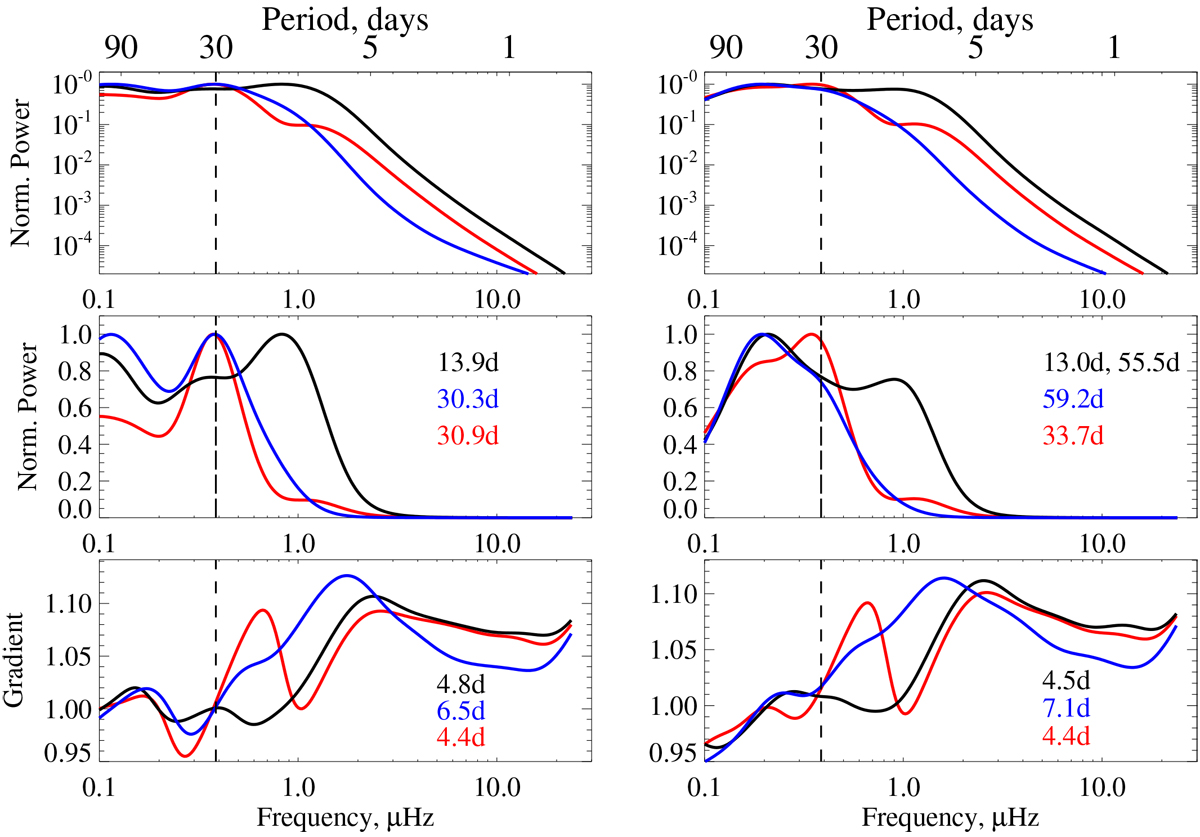
Power spectra of brightness variations of star rotating with a 30-day period plotted on logarithmic (upper panels) and linear (middle panels) scales. Also plotted are the gradients of the power spectra (lower panels). The calculations presented in left and right hand panels have been performed with the same set of model parameters (see text for details) but are associated with two different realizations of active regions emergences. Black, red, and blue curves correspond to total brightness variations (calculated with Sfac ∕Sspot = 5.5), as well as their facular and spot components, respectively. Numbers in the middle panels indicate peaks in the power spectra, while numbers in the lower panels point to positions of the inflection points.
Current usage metrics show cumulative count of Article Views (full-text article views including HTML views, PDF and ePub downloads, according to the available data) and Abstracts Views on Vision4Press platform.
Data correspond to usage on the plateform after 2015. The current usage metrics is available 48-96 hours after online publication and is updated daily on week days.
Initial download of the metrics may take a while.