Fig. 4
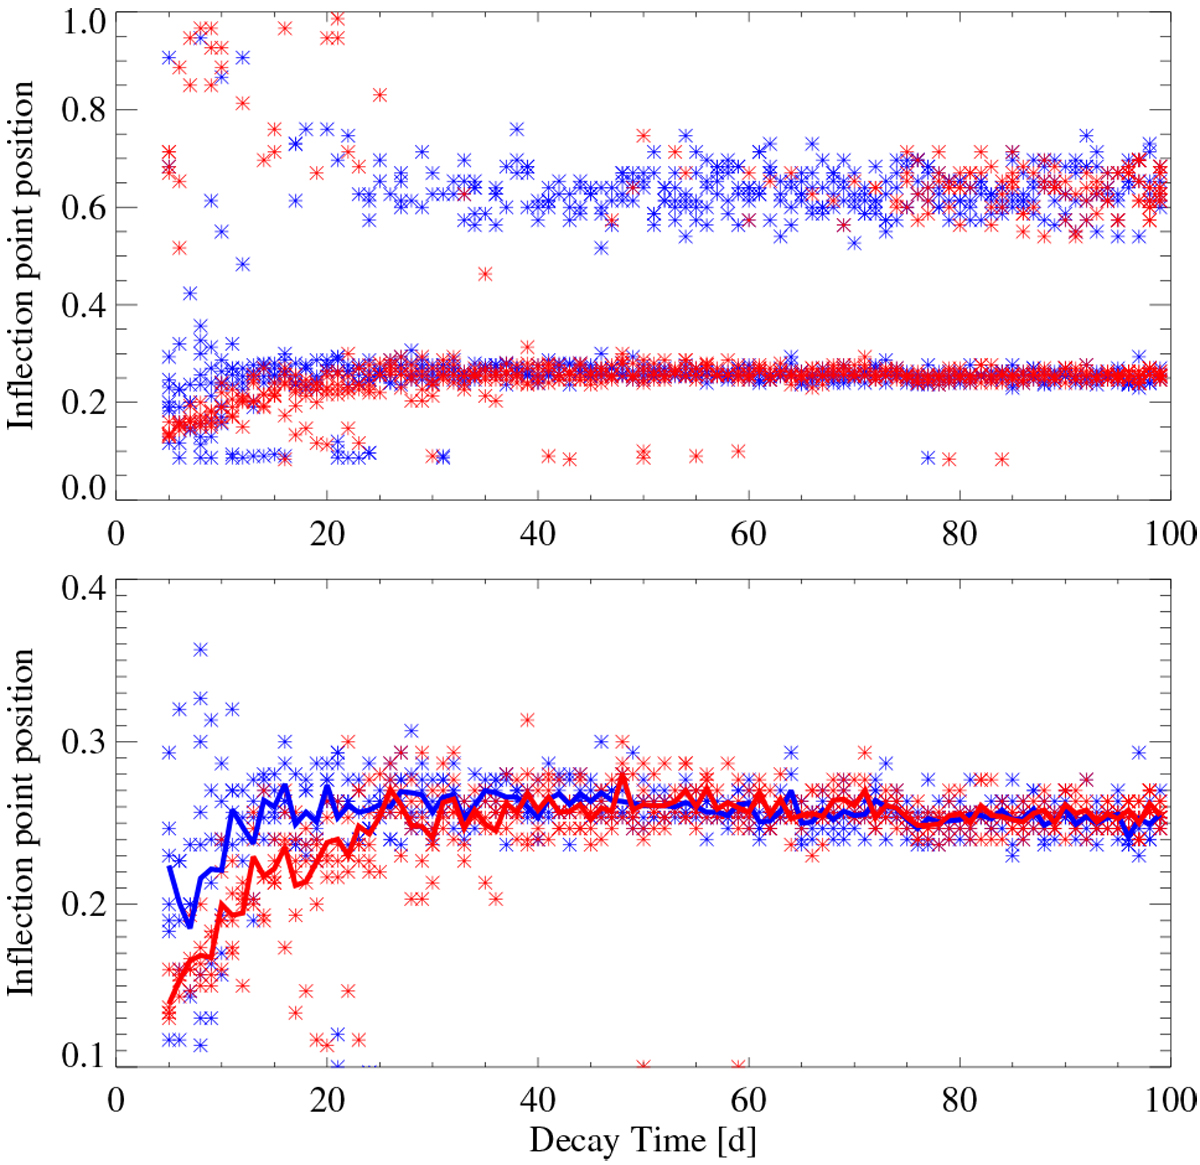
Dependence of inflection point position (in fractions of rotation period, Prot = 30 d) on spot lifetime, Tspot. Each value of the spot lifetime corresponds to five realizations of spot emergences with linear (red asterisks) and five realizations with exponential (blue asterisks) decay laws. Lower panel: zoom in of the upper panel. Blue and red lines in the lower panel show positions of the high-frequency inflection points averaged over corresponding five realizations.
Current usage metrics show cumulative count of Article Views (full-text article views including HTML views, PDF and ePub downloads, according to the available data) and Abstracts Views on Vision4Press platform.
Data correspond to usage on the plateform after 2015. The current usage metrics is available 48-96 hours after online publication and is updated daily on week days.
Initial download of the metrics may take a while.