Fig. 3
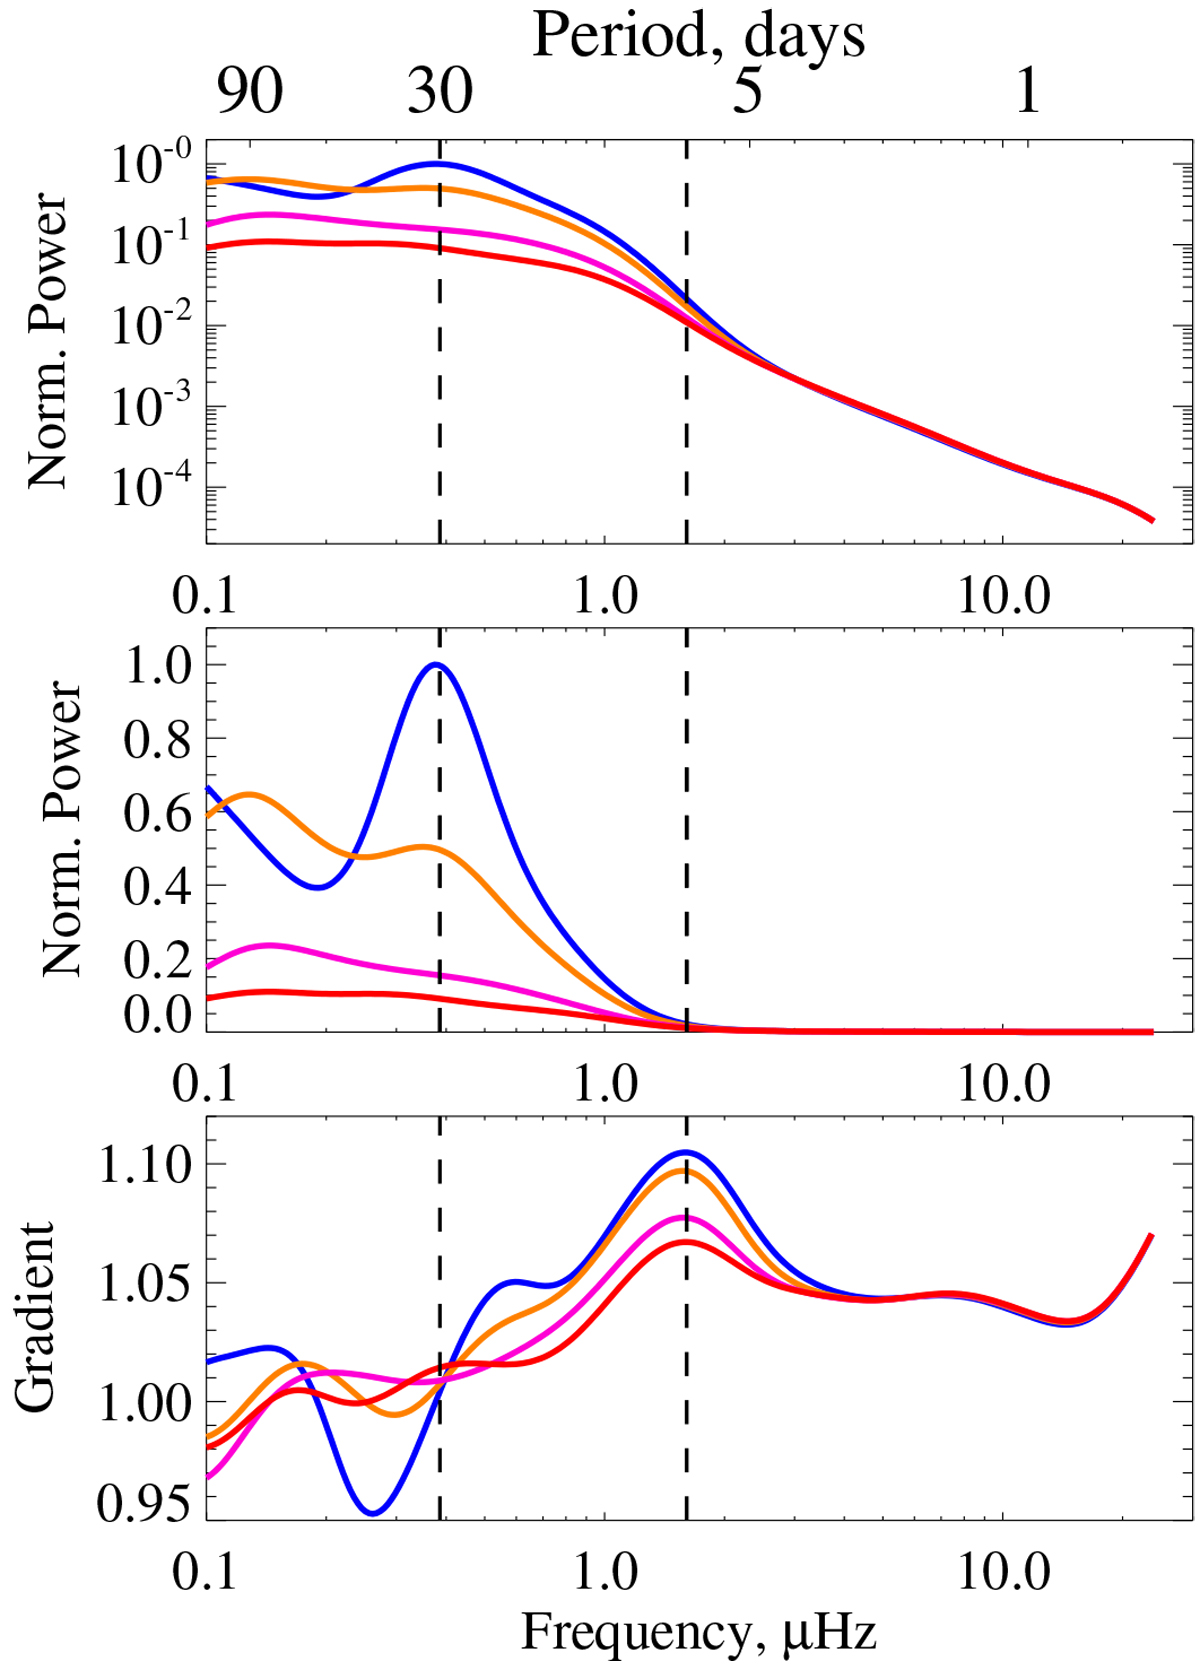
Power spectra of model light curves plotted on logarithmic (top panel) and linear (middle panel) scales on the vertical axis. The gradients of the power spectra in the top panel are plotted in the bottom panel. The modeled spots decay according to a linear law with lifetimes, Tspot, equal to: 90d (blue), 50 d (orange), 20 d (magenta), and 12 d (red). All four light curves are calculated for the same realization of spot emergences. Vertical dashed lines at 30 d and 7.2 d correspond to the rotation period of the simulated star and the approximate position of the inflection point in all four power spectra, respectively. Power spectra are calculated with the sixth-order Paul wavelet.
Current usage metrics show cumulative count of Article Views (full-text article views including HTML views, PDF and ePub downloads, according to the available data) and Abstracts Views on Vision4Press platform.
Data correspond to usage on the plateform after 2015. The current usage metrics is available 48-96 hours after online publication and is updated daily on week days.
Initial download of the metrics may take a while.